Burning the
midnight jet fuel
Airport particulate emissions a
hidden cost to the community
WHO reports that in 2012 around 7 million people died - one in eight of total global deaths – as a result of air pollution exposure.
25 March 2014 | Geneva - In new estimates released today, the World Health Organization issued a finding that some 7 million people died of air pollution caused disease in 2012 making air pollution the world’s largest single environmental health risk.
<http://www.who.int/mediacentre/news/releases/2014/air-pollution/en/>
<http://www.who.int/mediacentre/factsheets/fs313/en/>
Outdoor air pollution-caused deaths – breakdown by disease:
-
•40% – ischaemic heart disease;
-
•40% – stroke;
-
•11% – chronic obstructive pulmonary disease (COPD);
-
•6% - lung cancer; and
-
•3% – acute lower respiratory infections in children.
“Excessive air pollution is often a by-product of unsustainable policies in sectors such as transport, energy, waste management and industry. In most cases, healthier strategies will also be more economical in the long term due to health-care cost savings as well as climate gains,” says Dr Carlos Dora, WHO Coordinator for Public Health, Environmental and Social Determinants of Health. “WHO and health sectors have a unique role in translating scientific evidence on air pollution into policies that can deliver impact and improvements that will save lives.”
A 2013 assessment by WHO’s International Agency for Research on Cancer (IARC) concluded that outdoor air pollution is carcinogenic to humans, with the particulate matter component of air pollution most closely associated with increased cancer incidence, especially cancer of the lung. An association also has been observed between outdoor air pollution and increase in cancer of the urinary tract/bladder.
Ambient (outdoor air pollution) in both cities and rural areas was estimated to cause 3.7 million premature deaths worldwide per year in 2012; this mortality is due to exposure to small particulate matter of 10 microns or less in diameter (PM10), which cause cardiovascular and respiratory disease, and cancers.
for transport: shifting to clean modes of power generation; prioritizing rapid urban transit, walking and cycling networks in cities as well as rail interurban freight and passenger travel; shifting to cleaner heavy duty diesel vehicles and low-emissions vehicles and fuels, including fuels with reduced sulfur content;
for urban planning: improving the energy efficiency of buildings and making cities more compact, and thus energy efficient;
for power generation: increased use of low-emissions fuels and renewable combustion-free power sources (like solar, wind or hydropower); co-generation of heat and power; and distributed energy generation (e.g. mini-grids and rooftop solar power generation)
Particulate matter: The most health-damaging particles are those with a diameter of 10 microns or less, (≤ PM10), which can penetrate and lodge deep inside the lungs. Chronic exposure to particles contributes to the risk of developing cardiovascular and respiratory diseases, as well as of lung cancer.
BadwaterJournal.com
WHAT UNSUSTAINABLE URBAN GROWTH LOOKS LIKE
Published online at Louisville, Kentucky USA -
An independent, secular, contemporary journal of political and environmental issues dedicated to peaceful reduction of human impacts on Earth

Significant downwind pollution from air traffic at
Louisville Airport
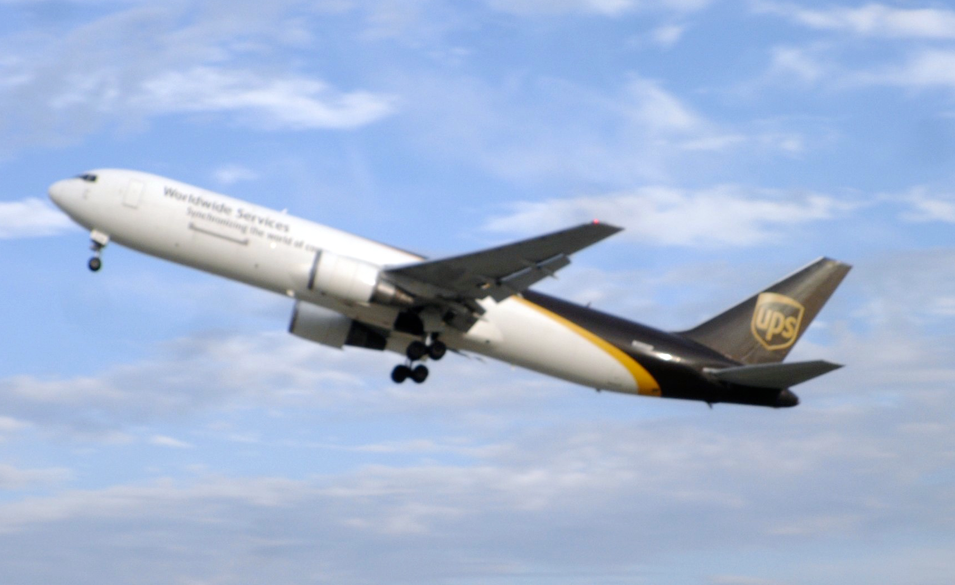
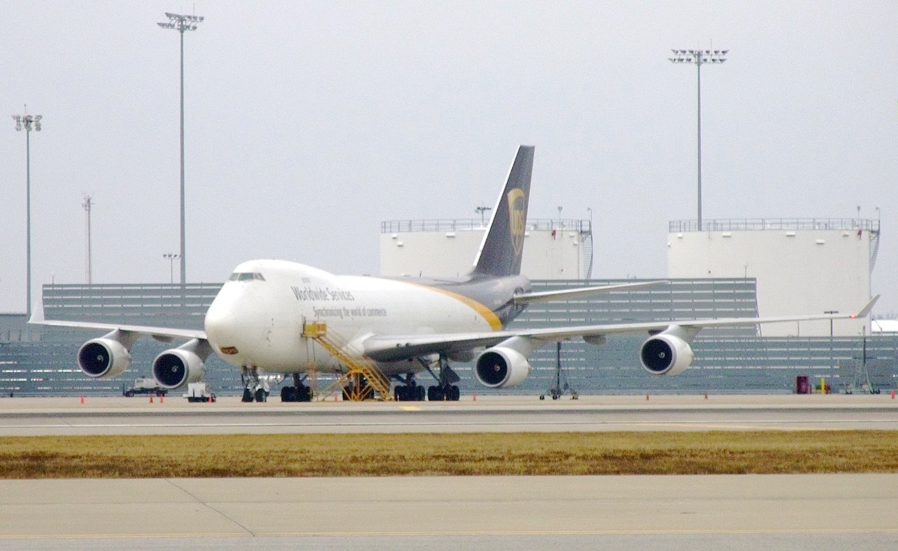
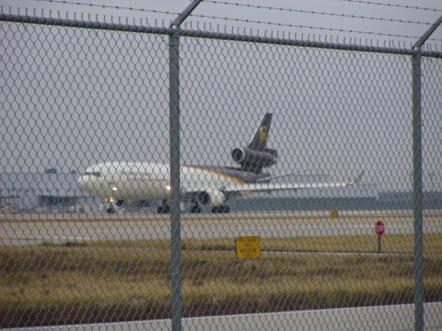
In the early morning hours, as you turn restlessly in your bed, the roaring begins as the UPS cargo jets begin tearing down the runway at the Worldport hub in the middle of Jefferson County, Kentucky. Every night dozens of huge cargo jets taxi to the head of the long runways at Louisville International Airport, pause for clearance from the tower, then gun their huge turbofan jet engines a thousand yards down the concrete runway before lifting into the sky. Each of the huge jet pods combusts fuel at many times the rate of a typical car or truck and the air pollution emissions are substantial and contribute to the public health impact in the area.
By its size and volume of commerce, UPS is a local economic engine pumping money into the local economy.
See, UPS and Louisville International Airport websites
“In 2008, Louisville International Airport handled more than 3.6 million passengers; 158,356 landings and take offs; and 4.3 billion pounds of cargo, making it the 3rd largest cargo airport in North America and 9th in the world.
The volume of goods shipped through Louisville International Airport more than quadrupled from 1986 to 2008.
In 2008, Louisville's airports generated recurring economic impacts of:
•More than 55,600 jobs
•Nearly $2 billion in payroll
•Over $5.6 billion in economic activity and
•More than $277 million in state and local taxes
http://www.flylouisville.com/About-the-Airport/About-the-Airport.aspx
Louisville International ranks third in North America—and tenth in the world—in the total amount of cargo handled as home of UPS's international air-sorting hub. The airport handled more than 4.7 billion pounds of cargo, freight and mail in 2010.”
“Worldport, UPS’s international air express hub, sits prominently between Louisville International Airport’s parallel runways, connecting Louisville to 200 countries and territories in mere hours. UPS initially invested $1 billion in Worldport, which opened in 2002.
In April 2010, UPS completed a $1 billion expansion that increased sorting capacity by 37 percent to 416,000 packages per hour.
The expansion plan, which added two aircraft load/unload "wings" to the hub and a high-speed conveyor and computer control systems, increased Worldport by 1.2 million square feet, to 5.2 million square feet (the equivalent of more than 90 football fields).”
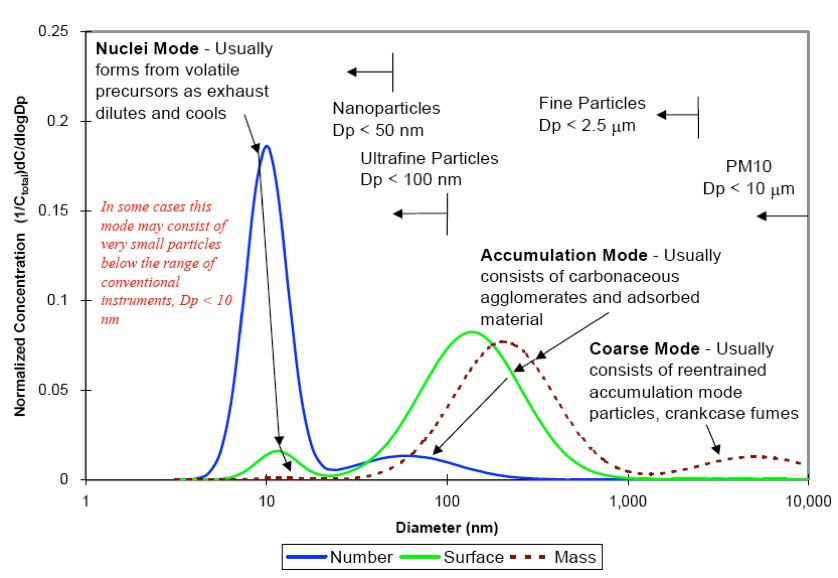
Ultrafine particulate from airport traffic
Aircraft Emission Impacts in a Neighborhood Adjacent to a General Aviation Airport in Southern California
Environ. Sci. Technol. 2009, 43, 8039–8045
Shishan Hu , Scott Fruin , Kathleen Kozawa, Steve Mara, Arthur M. Winer, and Suzanne E. Paulson
“In general, larger aircraft are associated with higher emissions and downwind concentrations of ultrafine particulate - UFP. “
[I]n the vicinity of Los Angeles International Airport (LAX) . . . markedly high UFP concentrations of about 5.0 x 105 cm-3 [50,000 nano particulate per cubic centimeter] were observed 500 m downwind of the takeoff runways (1). The observed downwind UFP number concentrations were dominated by freshly generated particles with peak modes of 10-15 nano meters, whereas upwind UFPs were dominated by aged particles with a mode of about 90 nm.
An impact area of elevated ultrafine particle (UFP) concentrations was observed extending beyond 660 meters downwind and 250 meters perpendicular to the wind on the downwind side of Santa Monica Airport. Aircraft operations resulted in average UFP concentrations elevated by factors of 10 and 2.5 at 100m and 660 m downwind, respectively, over background levels. The long downwind impact distance (i.e., compared to nearby freeways at the same time of day) is likely primarily due to the large volumes of aircraft emissions containing higher initial concentrations of UFP than on-road vehicles.
Aircraft fuel consumption rates during takeoff are roughly 50-300 grams per second for small piston or turboprop planes and can be up to about 500-5000 grams per second for the types of jets that operate at Santa Monica Airport (15), much higher than rates for motor vehicles of 1-10 grams per second. The fuel consumption rates for jets during takeoff tend to be high (up to several times those during cruise) because the jet engines are designed for high speeds and at high altitudes. This means aircraft emissions, especially during takeoff, have much higher volumetric flow rate than that of motor vehicles. This large volume of high concentration aircraft emissions is expected to take longer to be dissipated and diluted to the background level than vehicle emissions on roadways, consistent with our observations.
(1) Westerdahl, D.; Fruin, S.; Fine, P. L.; Sioutas, C. The Los Angeles international airport as a source of ultrafine particles and other pollutant to nearby communities. Atmos. Environ. 2008, 42, 3143–3155.
Take-off Emissions (1986–2008),’’ Eastern Research Group, May 2011.
A copy of this document can be found in public docket EPA–HQ–OAR–2010–0687
45017
http://aci-na.org/content/airport-traffic-reports
NOx EMISSIONS IN SELECTED OZONE NONATTAINMENT AREAS
2010 statistics
Non attainment areaMSA population take off/ %increase/
Landing decrease ‘09
Chicago-Gary-Lake County, IL-IN .............. 9,569,624 882,617 6.6
Cincinnati-Hamilton, OH-KY-IN ................. 2,130,151 177,597 -20.2
Indianapolis, IN ........................................... 1,756,241 166,358 -2.9
Louisville, KY-IN ........................................1,307,647 153,180 4.6
Memphis, TN-AR .............. ......................... 1,316,100 336,016 -.9
St. Louis, MO-IL .......................................... 2,845,298 185,720 -11.2
Estimated aircraft contributions to total area NOx (Louisville about 2%)
Non attainment area2008 total NOX (tons) ‘08 aircraft % 2020
Chicago-Gary-Lake County, IL-IN ..................... 6,007 1.8 5.0
Cincinnati-Hamilton, OH-KY-IN .......................... 1,287 1.5 3.3
Indianapolis, IN ................................................. 1,089 1.4 3.0
Louisville, KY-IN ................................................ 1,211 1.9 6.2
Memphis, TN-AR .............. ................................ 2,988 6.3 16.8
St. Louis, MO-IL ................................................... 810 0.6 1.6
The Metro Air Pollution Control District does not monitor particulate pollution in the region of the airport.
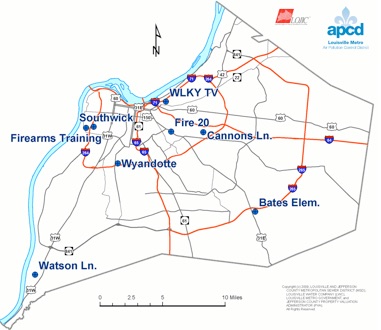
The location of the nearest MAPCD air monitor site, Wyandotte air monitoring station (closed) , is being closed because of repeated acts of vandalism. Even if it remained operational, it would probably not produce relevant air monitoring data for the airport. First, its more than a mile away and the prevailing winds would be out of the southwest or northwest blowing airport pollution away from the monitor.
Secondly, the pollution of concern is ultrafine nano particulate that the present monitoring equipment does not even count or detect. The PM 2.5 Federal Reference Method particulate monitoring misses the clouds of ultrafine nano particulates emitted by jets taking off and landing.
In 2012-2013 MAPCD had problems with their staff following laboratory procedures in conformity with the EPA protocols for quality assurance in particulate analysis.
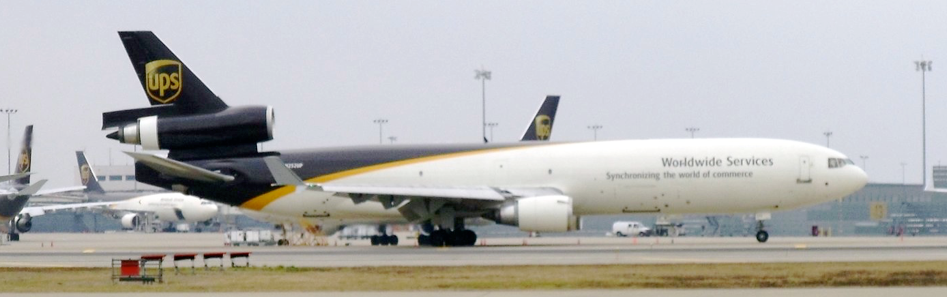
With massive power and grace a UPS workhorse jet moves to the runway for takeoff. This system operates at the top end of efficiency as a capitalist enterprise. What is not reflected on the balance sheet is the costs to public health and the environment, of the millions of gallons of jet fuel converted to tons of ultrafine air particulate off loaded to the local airshed. If each one of these large jets burns the same amount per second as 500 cars, and if one takes off an average of every four minutes, the airport has to be a local pollution ‘hot spot’ that is completely unreported by the selected methods of Jefferson County air monitoring data gathering.
The fact that it is unreported does not reduce the health effects caused by so much emission of ultra fine particulate. See related page: HERE
Aircraft activity clearly results in markedly elevated UFP
number concentrations, but because UFPs are so small, they make only modest contributions to mass concentrations.
For example, the average number concentration at Clarkson site B (100 m downwind) was about 9.7 x 104 cm-3 during the measurement periods, 10x the area background level.
The calculated mass contribution of UFP caused by aircraft averaged 0.6 μg m-3, assuming a particle density of 1.2 g cm-3 (1), only about 3% of the annual basin background level of ∼18 μg m-3 of PM2.5.
If 24-h measurements were conducted to obtain average particle mass concentrations, the contribution of aircraft-related UFP during the aircraft operation period, typically 07:00-23:00, would be even smaller, consistent with the SCAQMD measurements (5). It should be noted, however, that potential health effects of UFP generally focus on the size and number of such particles
and not their mass.
Aircraft Emission Impacts in a Neighborhood Adjacent to a General Aviation Airport in Southern California
Environ. Sci. Technol. 2009, 43, 8039–8045, 8042
Shishan Hu , Scott Fruin , Kathleen Kozawa, Steve Mara, Arthur M. Winer, and Suzanne E. Paulson
The Air Pollution Control District has issued an air pollution permit to United Parcel Service, pursuant to Title V of the Clean Air Act Amendments of 1990. Permit No: 146-97-TV. The permit covers ground based fueling and maintenance operations. Permit language indicated the Worldport operations were a major source of Nitrogen Oxides but not PM 2.5 particulate matter. Though compliant with EPA Clean Air Act methods, the permit is without reference to any particulate count data for areas at and around Worldport during typical flight operations. Thus a major health risk from ultrafine particulate is undocumented by the state air pollution control agency, pursuant to EPA approved air monitoring procedures. As the science of air quality improves, more researchers are insisting that the extent and epidemic health consequences of ultrafine air particulate exposure be controlled. Present monitoring methods are giving a false picture of air quality.
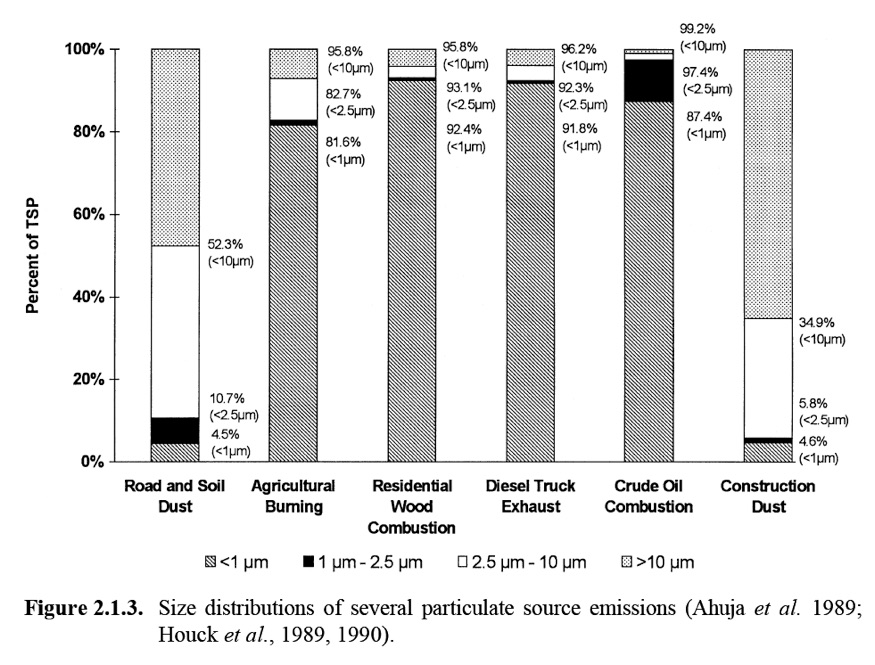
Particulate smaller than 1 micrometer seems to dominate combustion emissions total particulate, yet EPA does not require Air Pollution Control District to monitor or log particle count emissions of sizes less the PM 2.5 standard.
What EPA requires for regional air monitoring:
(a) The national primary and secondary ambient air quality standards for particulate matter are 15.0 micrograms per cubic meter (µg/m3 ) annual arithmetic mean concentration, and 35 µg/m3 24-hour average concentration measured in the ambient air as PM2.5
From the Federal Register EPA last revision of PM 2.5 NAAQS [71 FR 61224, Oct. 17, 2006]
Two sections of the Clean Air Act (CAA 42 U.S.C. 7401, et seq.) govern the establishment and revision of the National Ambient Air Quality Standards.
Section 108 (42 U.S.C. 7408) directs the Administrator to identify and list ‘‘air pollutants’’ that ‘‘in his judgment, may reasonably be anticipated to endanger public health and welfare’’ and whose ‘‘presence * * * in the ambient air results from numerous or diverse mobile or stationary sources’’ and to issue air quality criteria for those that are listed.
Air quality criteria are intended to ‘‘accurately reflect the latest scientific knowledge useful in indicating the kind and extent of identifiable effects on public health or welfare which may be expected from the presence of [a] pollutant in ambient air * * * .’
Section 109(b)(1) defines a primary standard as one ‘‘the attainment and maintenance of which in the judgment of the Administrator, based on such criteria and allowing an adequate margin of safety, are requisite to protect the public health.’’
The legislative history of section 109 indicates that a primary standard is to be set at ‘‘the maximum permissible ambient air level * * * which will protect the health of any [sensitive] group of the population,’’ and that for this purpose ‘‘reference should be made to a representative sample of persons comprising the sensitive group rather than to a single person in such a group’’ [S. Rep. No. 91–1196, 91st Cong., 2d Sess. 10 (1970)].
Thus, in selecting primary standards that include an adequate margin of safety, the Administrator is seeking not only to prevent pollution levels that have been demonstrated to be harmful but also to prevent lower pollutant levels that may pose an unacceptable risk of harm, even if the risk is not precisely identified as to nature or degree.
The CAA does not require the Administrator to establish a primary NAAQS at a zero-risk level or at a background concentration level (see Lead Industries Association v. EPA, supra, 647 F.2d at 1156 n. 51), but rather at a level that reduces risk sufficiently so as to protect public health with an adequate margin of safety.
The selection of any particular approach to providing an adequate margin of safety is a policy choice left specifically to the Administrator’s judgment. Lead Industries Association v. EPA, 647 F.2d at 1161–62.
Lead Industries Association v. EPA, 647 F.2d 1130, 1154 (D.C. Cir 1980), cert. denied, 449 U.S. 1042 (1980);
American Petroleum Institute v. Costle, 665 F.2d 1176, 1186 (D.C. Cir. 1981), cert. denied, 455 U.S. 1034 (1982).
In establishing primary and secondary standards, EPA may not consider the costs of implementing the standards.
See generally Whitman v. American Trucking Associations, 531 U.S. 457, 465–472, 475–76 (2001).
Federal Reference Method of measuring the weight of 2.5 micro meter particulate in a cubic meter sample acquired over a 1 hour period.
2.1
An electrically powered air sampler draws ambient air at a constant volumetric flow rate into a specially shaped inlet and through an inertial particle size separator (impactor) where the suspended particulate matter in the PM2.5 size range is separated for collection on a polytetrafluoroethylene (PTFE) filter over the specified sampling period. The air sampler and other aspects of this reference method are specified either explicitly in this appendix or generally with reference to other applicable regulations or quality assurance guidance.
2.2
Each filter is weighed (after moisture and temperature conditioning) before and after sample collection to determine the net gain due to collected PM2.5. The total volume of air sampled is determined by the sampler from the measured flow rate at actual ambient temperature and pressure and the sampling time. The mass concentration of PM2.5in the ambient air is computed as the total mass of collected particles in the PM2.5size range divided by the actual volume of air sampled, and is expressed in micrograms per cubic meter of air (µg/m3 ).
Related pages this site:
Non-attainmnet HERE
Particulate HERE
Air Monitoring HERE
Air Pollution HERE
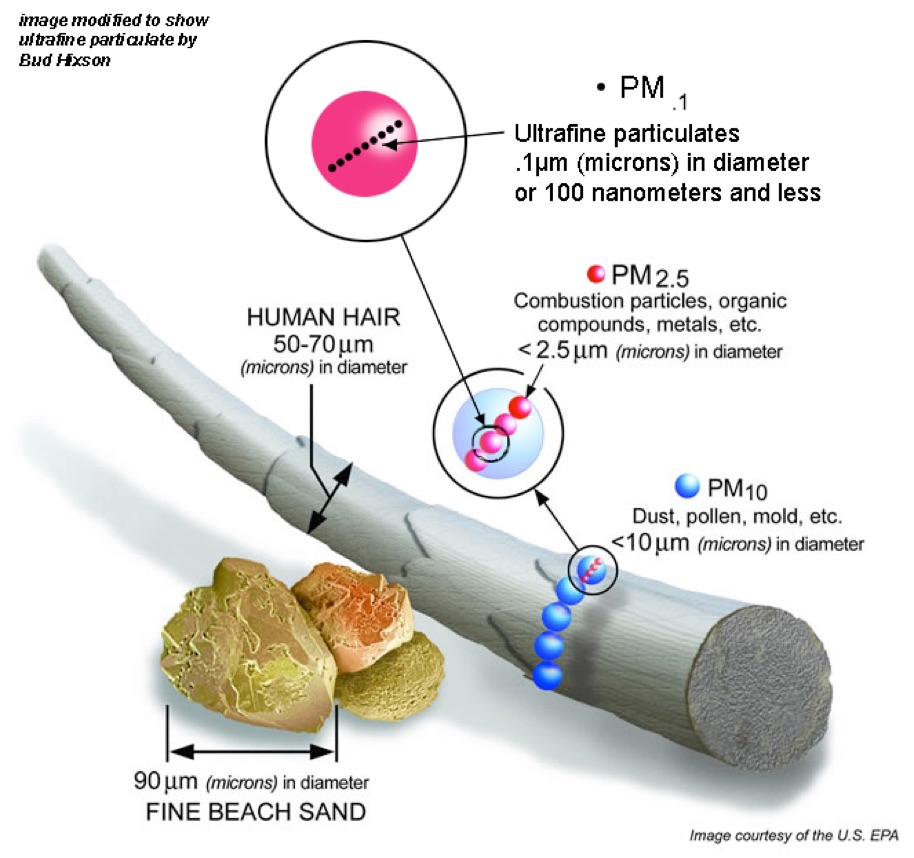
UFP are unmonitored and unregulated in the United States but comprise some 85% of emissions by particle number
50,000 UFP per cubic centimeter concentrations at 500 feet from the runway is less than 1,000,000 near freeways
(c) The 24-hour primary and secondary PM2.5standards are met when the 98th percentile 24-hour concentration, as determined in accordance with appendix N of this part, is less than or equal to 35 µg/m3 .
[71 FR 61224, Oct. 17, 2006]
(particles with an aerodynamic diameter less than or equal to a nominal 2.5 micrometers) by either:
(1) A reference method based on appendix L of this part and designated in accordance with part 53 of this chapter; or
(2) An equivalent method designated in accordance with part 53 of this chapter.
(b) The annual primary and secondary PM2.5standards are met when the annual arithmetic mean concentration, as determined in accordance with appendix N of this part, is less than or equal to 15.0 µg/m3 .
reformatted April 3, 2014