PEAKS OF CONDUCTIVITY
Conductivity measures the ability of a wire or other medium to carry electrical current. When metals or dissolved solids from road runoff pollute a stream they increase the conductivity. Measuring conductivity is a good indicator of road salt contamination. Kentucky state and local transportation officials apply tons of road salt to the roads and the road salt is contaminating streams and killing stream life.
A leading peer reviewed journal, Environmental Science and Technology, carried a well researched article on road salt that observed:
“[Monitoring] demonstrate a substantial effect from road salt on streamwater quality and aquatic life. Bioassay results from runoff events confirm that the observed high concentrations of road salt caused acute and chronic toxicity to aquatic organisms. In addition, continuous specific conductance results indicate that elevated levels of road salt were present multiple times per year each year of monitoring. Populations of aquatic organisms in these streams and others with such road-salt influence are likely limited to salt-tolerant species.”
“Road-salt runoff poses an increasing threat to aquatic
ecosystems that are influenced by urban land use and
transportation corridors. Four broad issues suggest that roadsalt runoff is a serious and increasing threat to the nation’s receiving waters.
First, there is a multitude of historical evidence documenting detrimental effects of road salt on water chemistry and aquatic life. This issue was recognized
at least as early as the 1960s (1). Studies have continued each decade since then, with more comprehensive evidence of water-quality impacts from road salt. A small sampling of some representative topics studied includes specific water quality impacts such as increased chloride and sodium concentrations, seasonality, climatic and land-use influence, vertical density gradients, and influence on sediment pore water, mixing and alteration of turnover in lakes (2-5), and aquatic toxicity impacts (2, 6, 7).
Second, road salt usage in the United States has increased steadily beginning in the 1940s through the current decade (8, 9). Average annual salt sales in the United States for deicing purposes by decade beginning in 1940 were 0.28 (1940s), 1.1 (1950s), 4.1 (1960s), 8.7 (1970s), 8.8 (1980s), 13.0 (1990s), and 16.0 (2000-2008)
million metric tons per year.
Third, urban development is increasing each year (10), which increases the amount of impervious area on which winter deicing operations are conducted. This collective information suggests that the increasing road-salt usage trends of the previous seven decades will likely continue under current management conditions.
Fourth, chloride, and to a large degree sodium, the two primary ions in road salt, remain in solution, making it difficult with present-day technology to design effective management practices for reduction of road-salt loadings to receiving waters after application. Currently, reduction in usage appears to be the only effective road-salt-runoff
management strategy.”
Steven R. Corsi et al,
A Fresh Look at Road Salt: Aquatic Toxicity and Water-Quality Impacts on Local, Regional, and National Scales
<http://pubs.acs.org/doi/abs/10.1021/es101333u>
Chloride concentrations exceeded U.S. Environmental Protection Agency (USEPA) acute (860 mg/L) and chronic (230 mg/L) water-quality criteria
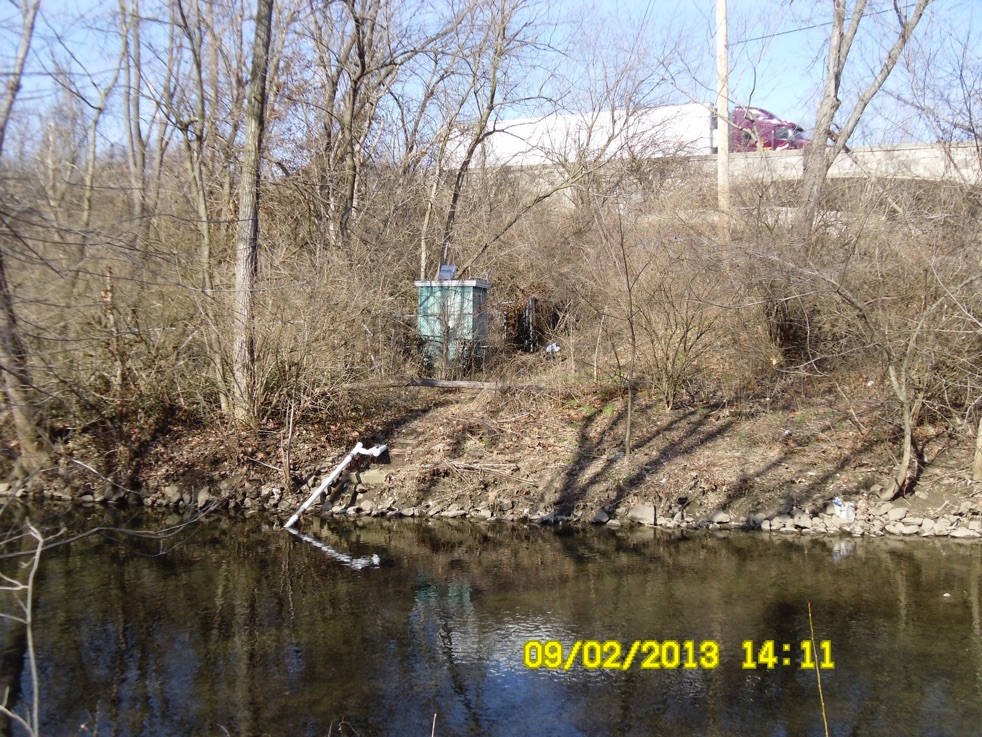
USGS Streamflow monitoring station at
Old Cannons Lane on Middle Fork of
Beargrass Creek. The creek is flanked by I-64
and this location is downstream of the Watterson
Expressway, St Matthews and Oxmoor Mall parking lots.
“The analysis of historical chloride data from urban areas around the country indicated potential for considerable and widespread impact from road salt on surface water quality and aquatic life.
Despite the limitation that sample results from these selected areas were from numerous studies not necessarily designed to capture periods of road-salt runoff, the influence of road salt was clear.
Streams with urban influence throughout the country in areas where road salt is applied are at risk for substantial contamination and
detrimental effect on aquatic life.”

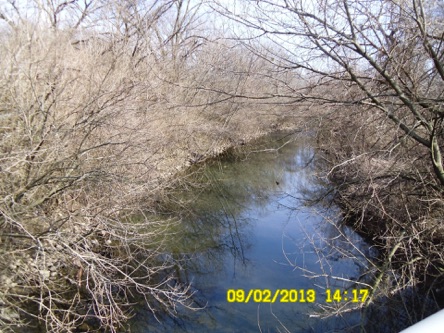
The Beargrass Creek stream bed is covered with dirty algea. This is a highly impacted urban stream that is substantially dead due to urban runoff contamination.
See what Road salt does to roads and bridges:
Corrosion HERE
See what Road salt does to roads and bridges:
Sherman Minton HERE
EXTERPATION OF MACROINVERTEBRATES AT
300 MICROSIEMENS CONDUCTIVITY
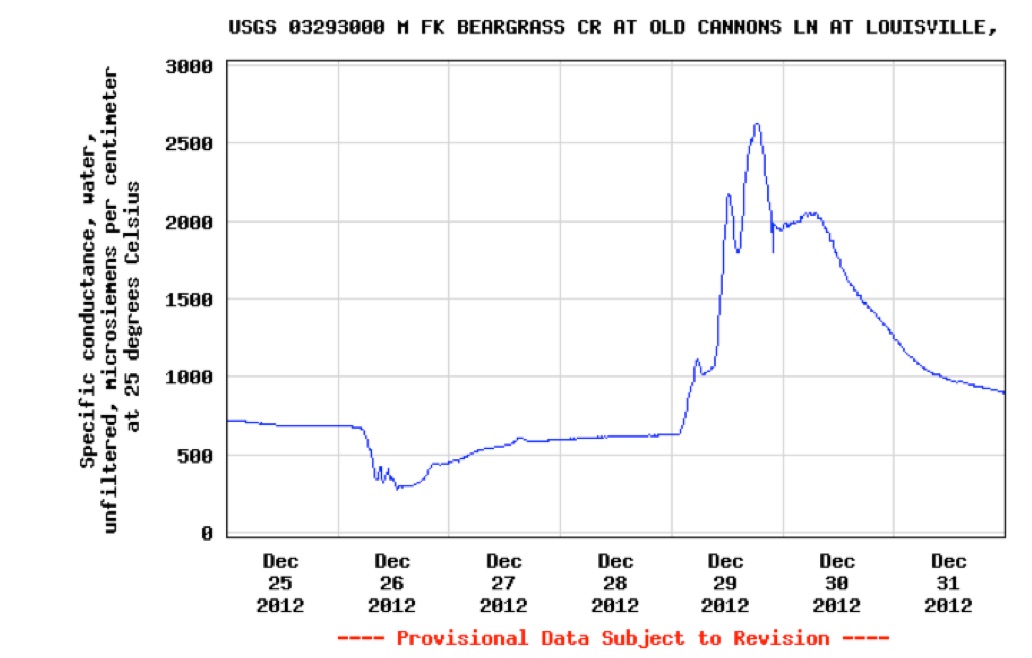
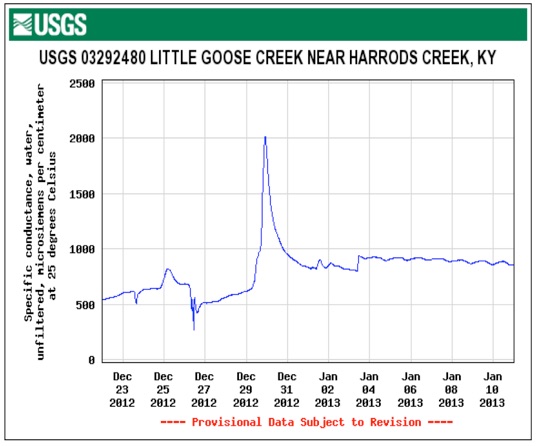
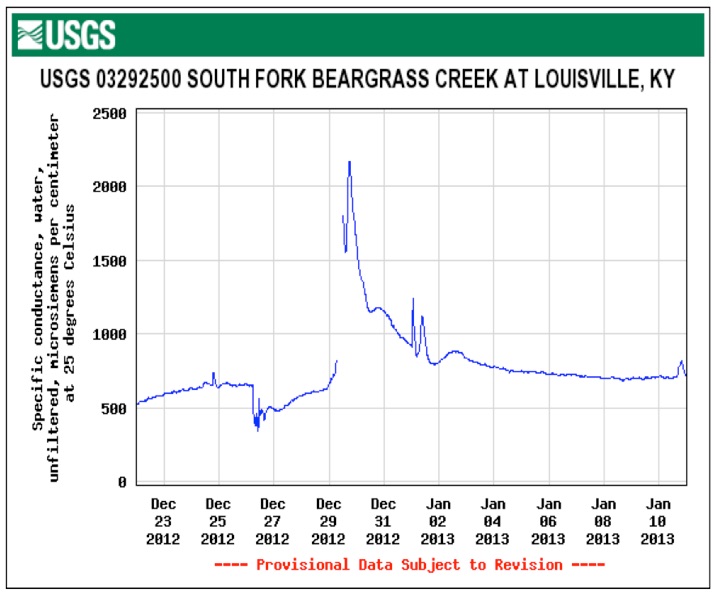
Highway runoff levels in Louisville Kentucky deliver conductivity readings above 2500 microsiemens per centimeter yet watergroups petition to EPA to mandate state level numerical conductivity limits is targeted at mountaintop removal and seeks a numerical limit of 300 microsiemens per centimenter. Look at the graphs obtained from USGS below. They go a long way to explain the absence of stream diversity in urban impacted waters where automobile metal scrapings --nickel, copper, zinc, iron, manganese and road deicing chloride, cause spikes in conductivity levels.
In 2011, EPA published two peer-reviewed scientific reports documenting the harm caused by conductivity and mountaintop removal mining valley fills. This research showed that a significant percent of aquatic life is extirpated when conductivity reaches 300 microsiemens per centimeter (μS/cm). While EPA’s 2011 guidance based on that research has been nullified by a district court for procedural reasons, that case is on appeal, and the court did not question the underlying science which remains valid.
July 2011 Guidance at 16 (citing EPA Office of Research & Development Final Report: A Field-based Aquatic Life Benchmark for Conductivity in Central Appalachian Streams
(May 27, 2011)).
"Extirpation concentrations of specific conductance were estimated
from the presence and absence of benthic invertebrate genera from 2,210 stream samples in West Virginia. The extirpation concentration is the 95th percentile of the distribution of the probability of occurrence of a genus with respect to specific
conductance. In a region with a background of 116 μS/cm, the 5th percentile of the species sensitivity distribution of extirpation concentrations for 163 genera is 300 μS/cm. Because the benchmark is not protective of all genera and protects
against extirpation rather than reduction in abundance, this level may not fully protect sensitive species or higher-quality, exceptional waters."
"Using the same water quality data used by EPA, but a different statistical method for analyzing that data, they independently derived a threshold of 308 μS/cm for biological impairment related to increased conductivity. That value is essentially the same as the 300 μS/cm lower value in the range cited in EPA’s 2011 guidance and derived in 2012 by Cormier et al."
UPDATED to show
300 microsiemens macroinvertebrates
exterpation
PEAKS OF CONDUCTIVITY
<http://www.ncbi.nlm.nih.gov/pmc/articles/PMC2776691/>
Metals associated with stormwater-relevant brake and tire samples
Erica R. McKenzie, Jon E. Money, Peter G. Green, and Thomas M. Young
*Properly apportioning the loads of metals in highway stormwater runoff to the appropriate sources requires accurate data on source composition, especially regarding constituents that help to distinguish among sources. Representative tire and brake samples were collected from privately owned vehicles and aqueous extracts were analyzed for twenty-eight elements. Correlation principal components analysis (PCA) revealed that tires were most influenced by Zn, Pb, and Cu, while brakes were best characterized by Na and Fe followed by Ba, Cu, Mg, Mn, and K; the latter three may be due to roadside soil contributions. Notably elevated Cd contributions were found in several brake samples. A targeted Cd-plated brake rotor was sampled, producing results consistent with the elevated levels found in the larger sample population. This enriched source of Cd is of particular concern due to high toxicity of Cd in aquatic ecosystems.
Chemosphere. 2001 Aug;44(5):997-1009.
Loading estimates of lead, copper, cadmium, and zinc in urban runoff from specific sources.
Source
Department of Civil and Environmental Engineering, University of Maryland, College Park 20742, USA. apdavis@eng.umd.edu
Abstract
Urban stormwater runoff is being recognized as a substantial source of pollutants to receiving waters. A number of investigators have found significant levels of metals in runoff from urban areas, especially in highway runoff. As an initiatory study, this work estimates lead, copper, cadmium, and zinc loadings from various sources in a developed area utilizing information available in the literature, in conjunction with controlled experimental and sampling investigations. Specific sources examined include building siding and roofs; automobile brakes, tires, and oil leakage; and wet and dry atmospheric deposition. Important sources identified are building siding for all four metals, vehicle brake emissions for copper and tire wear for zinc. Atmospheric deposition is an important source for cadmium, copper, and lead. Loadings and source distributions depend on building and automobile density assumptions and the type of materials present in the area examined. Identified important sources are targeted for future comprehensive mechanistic studies. Improved information on the metal release and distributions from the specific sources, along with detailed characterization of watershed areas will allow refinements in the predictions.


The monitoring shed at
Old Cannons Lane
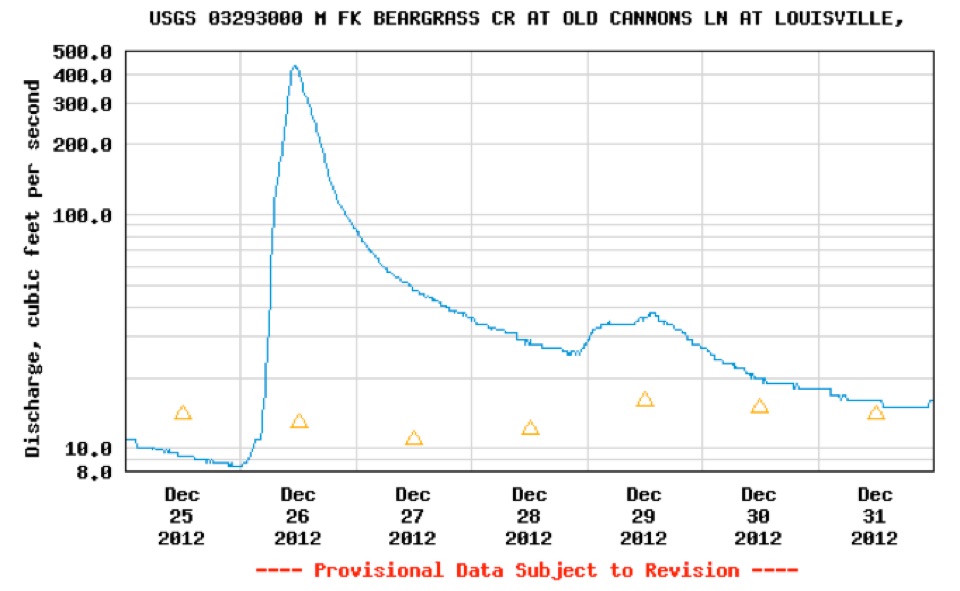
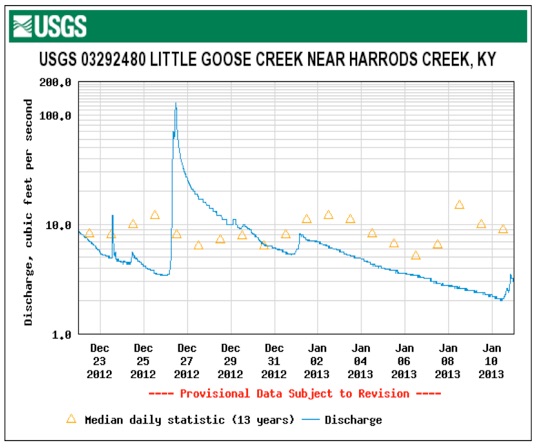
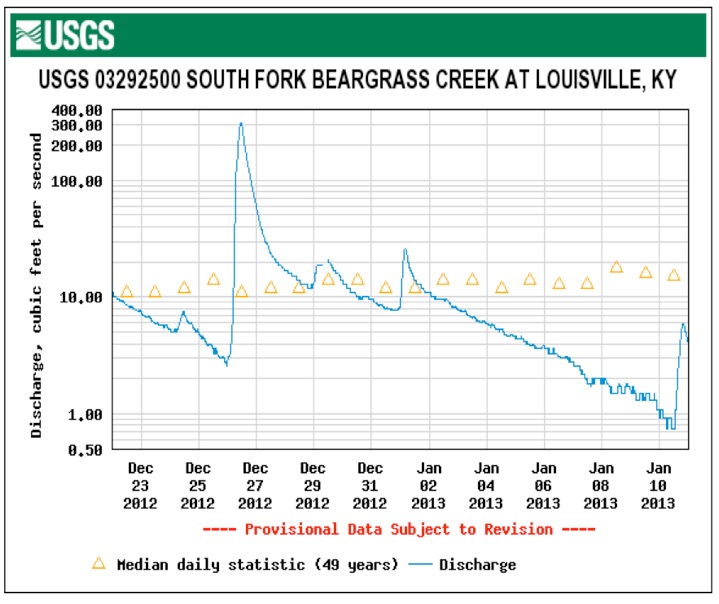
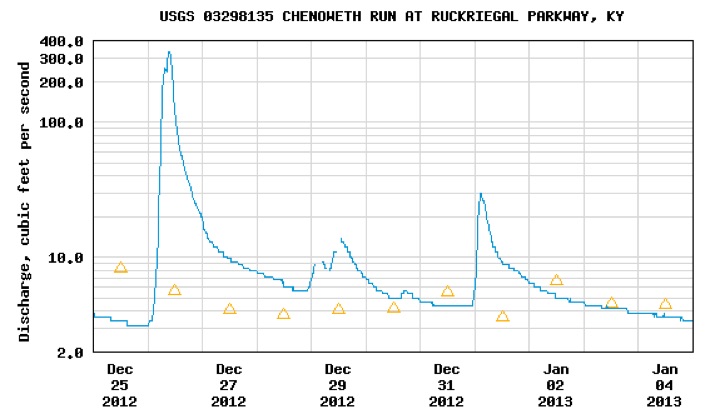
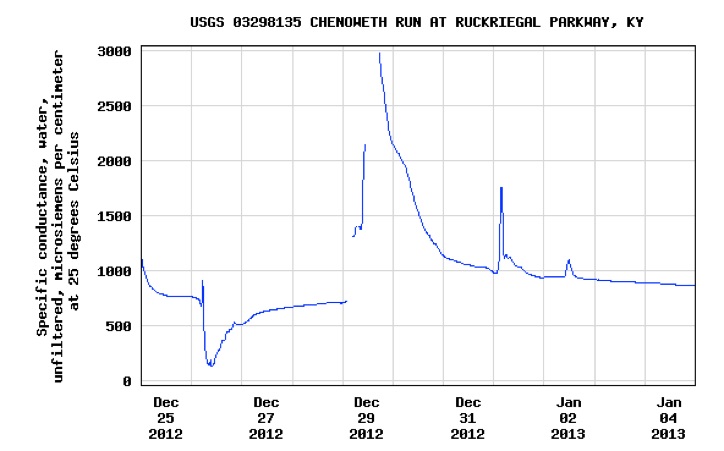
This graph obtained from the USGS online water quality site shows the rainfall event at Christmas in Louisville followed by lower temperatures and snowfall. Work crews didn’t pre-apply deicing solution because the rain would wash it off. Instead, road salt was applied after snow began to fall. Runoff of rain began to increase the stream flow at the Old Cannons Lane station beginning on the 26th of December and peaking above 400 cubic feet per second around noon. Thereafter, stream flow declined for the next two days. Road crews began applying road salt. From December 29th the salt began to runoff into the creek with a peak value the evening of December 29.
P
LOUISVILLE, Ky. (WDRB) -- After at least two winters without a significant snowfall, the Metro Louisville area could get receive as much as six inches of snow by late Saturday.
Late Friday afternoon the National Weather Service issued a Winter Storm Warning for most of WDRB's southern Indiana counties from 7 p.m. until 7 a.m. A Winter Weather Advisory was issued for Louisville and points south.
Snow began falling before 9 p.m. in Louisville, and reports of rain changing to snow came from southern Indiana and several points in Louisville Metro. Major roads remained wet through 11 p.m., but the snow was expected to stick once pavement temperatures dropped.
Road crews began staging before 9 p.m. as well. They planned to spend the night spreading chemicals and eventually plowing snow.
Graph of streamflow at Old Cannons Lane
Graph of conductivity at Old Cannons Lane
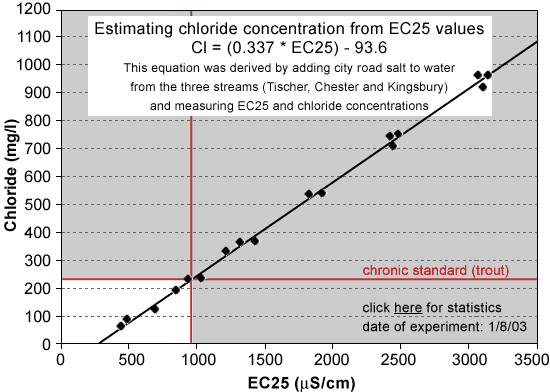
Acute Standard 860 mg/L
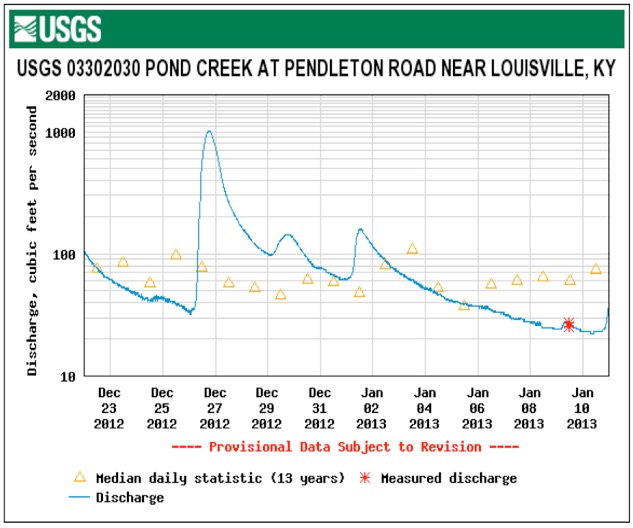
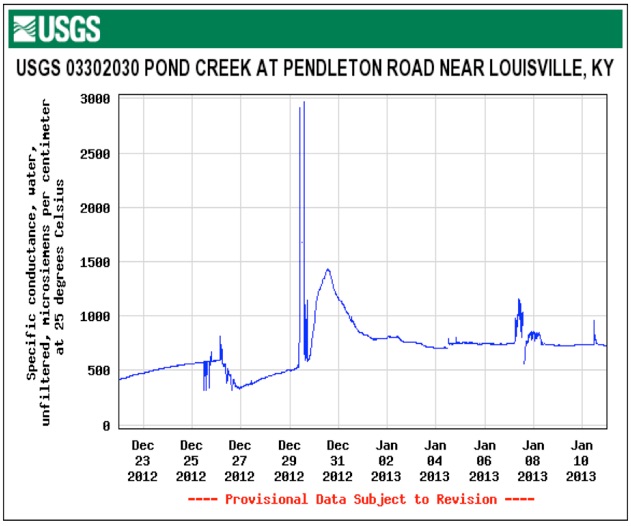
These graphs show the flow and measured conductivity at Pond Creek where Pendleton Road crosses in the southwest corner of Jefferson County. The extreme peaks in conductivity lead one to infer strong concentrations of road salt impacting the creek in a sort period as if dumped.
The Gene Snyder Freeway and Dixie Highway both drain to Pond Creek upstream of the monitoring station.
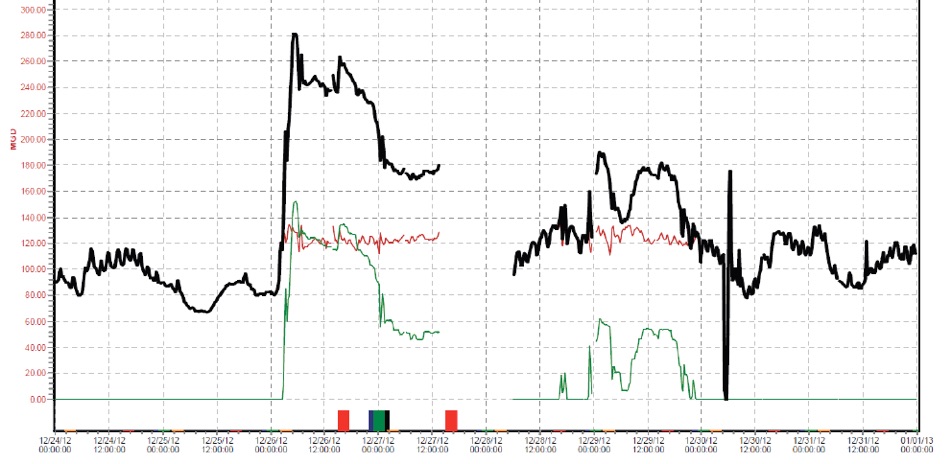
See the Morris Forman graphs below. The one inch rain event that began on Christmas caused Louisville’s main treatment plant to bypass untreated sewage discharges to the Ohio River and to streams with CSOs in the collections system. A one inch rainfall causes huge sewer flows mixed with stormwater to come into the main treatment plant.
The graph shows on 12-26, plant effluent by-pass began and peaked at flow rate of 150 million gallons per day then declining to 50 million gallons per day by 12-27. Untreated sewage from CSOs and SSOs discharging to creeks could result in elevated solids and ions causing increased conductivity in addition to road salt applications.
See related webpages:
Road salt HERE
Parking lot and road runoff contribute to sewer overflows
Online USGS water testing results for Louisville
<http://waterdata.usgs.gov/ky/nwis/si>
MSD wet weather overflow reports

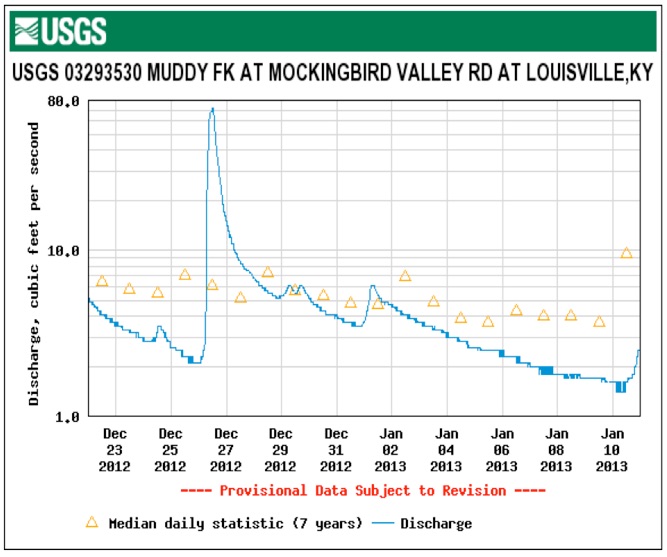
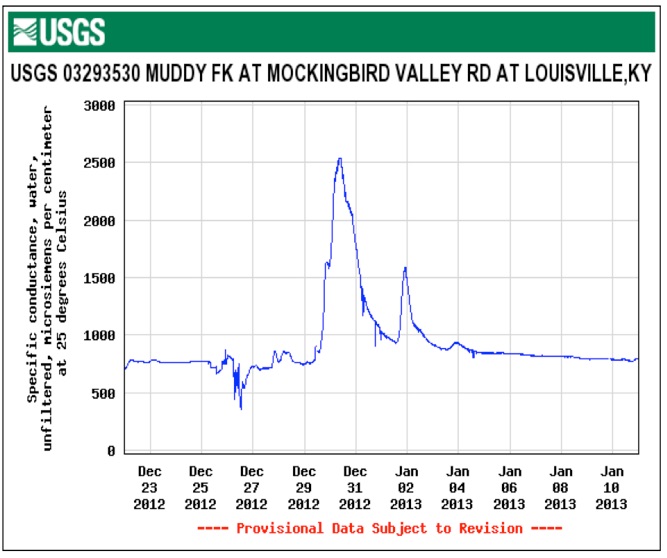
These graphs show the flow and measured conductivity at the Muddy Fork USGS station. This station receives stormwater runoff from I-71 and can be seen as the dark creek corridor running below I-71 in this Google Map
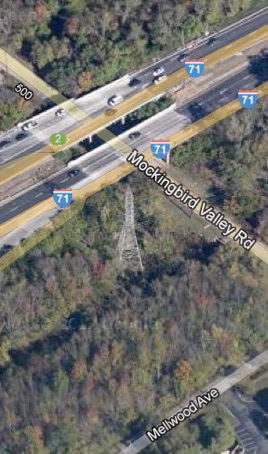
This monitoring station may be affected by sewer overflows from MSD force mains and pump stations running from Prospect to Downtown.
The same pattern of rising stream flow followed by increasing conductivity to near acute concentration levels of 860 mg/L is seen. The high stream flow dilutes the concentration which increases as the stream volume falls and groundwater and runoff flows continue to carry roadsalt into the streams. We need transportation alternatives to salted roads.
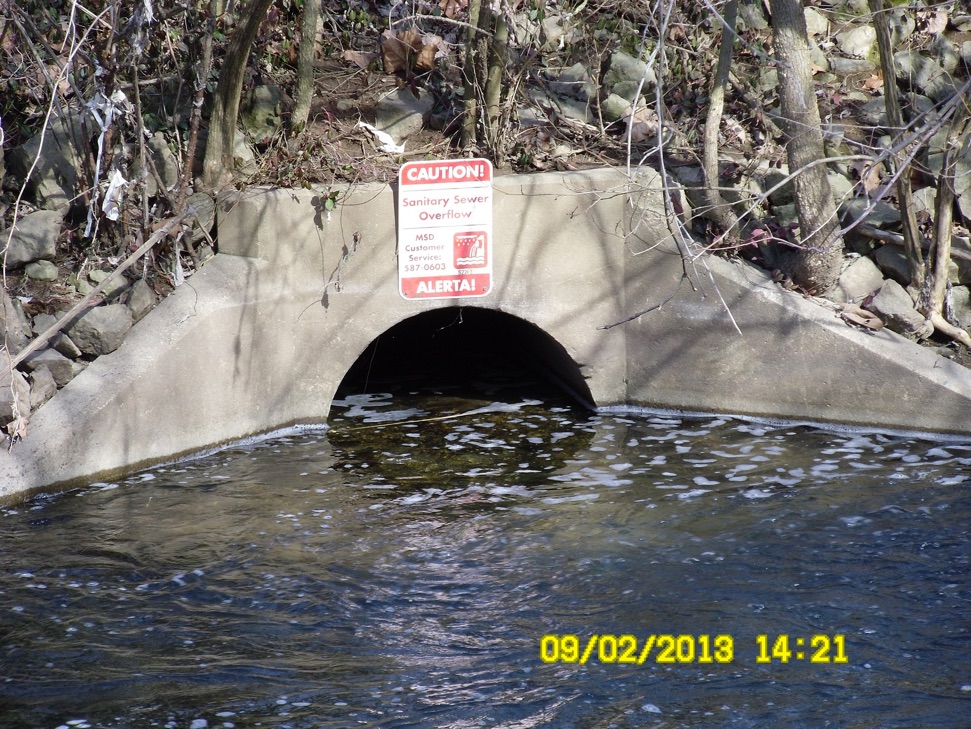
Upstream of the Old Cannons Lane monitoriing station are several sanitary sewer overflow discharge outlets that dump human wastewater and commercial effluent into the creek depending on the infux of storm water into MSD’s sewer lines. A main sewer line runs from the eastern part of Jefferson County along the Middle Fork of Beargrass Creek to Butchertown where it is pumped to the Morris Forman WWTP on Algonquin in the West End. Many points along the line spill untreated sewage to the creeks in wet weather.
Electro conductivity in micro siemens/cm

Indiana and Kentucky transportation crews prepare for snow storm
Posted: Dec 25, 2012 10:26 PM EST Updated: Jan 01, 2013 10:26 PM EST
By Maira Ansari -
CLARK COUNTY, IN (WAVE) - This weather system moving into Kentuckiana will be impacting many who decide to hit the road, mainly affecting the Indiana area. Some Indiana counties will be under a blizzard warning for most of Wednesday.
The Indiana Department of Transportation is rolling out their crews before the storm hits.
"We've got crews that will be coming in early 7:00 this evening," said Greg Prince from INDOT. "We'll have a partial crew
that will be patrolling the roadways loaded down with salt and ready for whatever conditions that happen at that time."
A full call out crew will be moving in around midnight. INDOT says because rain is in the forecast, there isn't much they can
do to pre-treat the roads in Southern Indiana.
"When we apply brine down to road many times when we get that rain before the storm it just washes it off," said Prince.
In a press release, Kentucky Transportation Cabinet (KYTC) District 5 says staff in Louisville are monitoring the weather
Back to Welcome page
exceeds acute standard
exceeds acute standard
chronic standard
chronic chloride standard
chronic standard
chronic chloride standard
chronic chloride standard
exceeds acute standard 860 mg/L
chronic chloride standard 230 mg/L
http://water.epa.gov/type/rsl/monitoring/vms59.cfm
Conductivity is a measure of the ability of water to pass an electrical current. Conductivity in water is affected by the presence of inorganic dissolved solids such as chloride, nitrate, sulfate, and phosphate anions (ions that carry a negative charge) or sodium, magnesium, calcium, iron, and aluminum cations (ions that carry a positive charge). Organic compounds like oil, phenol, alcohol, and sugar do not conduct electrical current very well and therefore have a low conductivity when in water. Conductivity is also affected by temperature: the warmer the water, the higher the conductivity. For this reason, conductivity is reported as conductivity at 25 degrees Celsius (25 C).The basic unit of measurement of conductivity is the mho or siemens. Conductivity is measured in micromhos per centimeter (µmhos/cm) or microsiemens per centimeter (µs/cm). Distilled water has a conductivity in the range of 0.5 to 3 µmhos/cm. The conductivity of rivers in the United States generally ranges from 50 to 1500 µmhos/cm. Studies of inland fresh waters indicate that streams supporting good mixed fisheries have a range between 150 and 500 µhos/cm.
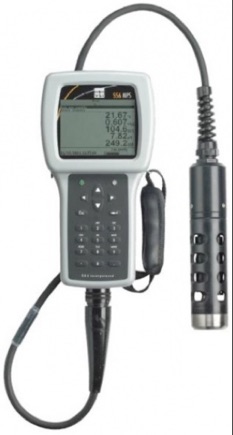
Conductivity meter and probe
http://water.epa.gov/type/rsl/monitoring/vms59.cfm
Conductivity is useful as a general measure of stream water quality. Each stream tends to have a relatively constant range of conductivity that, once established, can be used as a baseline for comparison with regular conductivity measurements. Significant changes in conductivity could then be an indicator that a discharge or some other source of pollution has entered a stream.
Conductivity is measured with a probe and a meter. Voltage is applied between two electrodes in a probe immersed in the sample water. The drop in voltage caused by the resistance of the water is used to calculate the conductivity per centimeter. The meter converts the probe measurement to micromhos per centimeter and displays the result for the user.
NOTE: Some conductivity meters can also be used to test for total dissolved solids and salinity. The total dissolved solids concentration in milligrams per liter (mg/L) can also be calculated by multiplying the conductivity result by a factor between 0.55 and 0.9, which is empirically determined (see Standard Methods #2510, APHA 1992).
Suitable conductivity meters cost about $350. Meters in this price range should also measure temperature and automatically compensate for temperature in the conductivity reading.
Conductivity can be measured in the field or the lab. In most cases, it is probably better if the samples are collected in the field and taken to a lab for testing. In this way several teams of volunteers can collect samples simultaneously. If it is important to test in the field, meters designed for field use can be obtained for around the same cost mentioned above.
If samples will be collected in the field for later measurement, the sample bottle should be a glass or polyethylene bottle that has been washed in phosphate-free detergent and rinsed thoroughly with both tap and distilled water. Factory-prepared Whirl-pak® bags may be used.
ROUGH CALCULATION
The four lane East End Bridge roadway from the US 42 area to the Indiana shore is about 11,500 feetand averages 130’ wide which multiplies out to 1,495,000 sq. ft. or about 34.3 acres. In a one inch rain that collection area could deliver 931,945 gallons of stormwater to Harrods Creek. I’ll use the .95 runoff coefficient FHWA uses for highway pavement to arrive at 885,347 gallons
Road salt is applied between 200 and 500 libs per lane mile. 4 lanes times 2.178 miles is 8.7 lane miles.
8.7 X 200 lbs is 1,740 lbs roadsalt
8.7 X 500 lbs is 4,350 lbs roadsalt
885,347 gallons times 3.785 L/gal =
3,351,038 liters
1,740 lbs X .45359 lbs/kg = 789.2 kg
4,350 lbs X .45359 lbs/kg = 1,973 kg
Convert kilos to milligrams and divide by Liters to get mg/L concentrations
discharged to Harrods Creek
Low end application = 235.5 mg/L
High end application= 588.7 mg/L
<http://www.fhwa.dot.gov/engineering/hydraulics/pubs/08090/02.cfm>
These calculations correspond well to the conductivity measurements for deicing applications running off between Dec 25 and Jan 4, 2012
300 microsiemens per centimeter
300 microsiemens per centimeter
300 microsiemens per centimeter
300 microsiemens per centimeter
300 microsiemens per centimeter
300 microsiemens per centimeter