Greenfield development in Metro Louisville’s east end leaves the west end in decay,  condemning another generation to repeat cycles of poverty.


Despite lip service to smart growth concepts Metro developers are building a multi-center county-wide, sprawling urban area. Road funds are used to build inefficient concrete highways and bridges to a new Caucasian East Louisville.

Trapped in the failing economy of the West End, low income people are the jail fodder of the prison industrial complex.


                Welcome to BadwaterJournal.com©                                                   INDEX PAGE for all articles

What we have done here--

    Structural Racism


In “Metro Rail, Social Justice, and Urban Form” <http://www.urbanhabitat.org/node/958> available on the internet, author Raymond L. Rhodes, speaking of Los Angeles said: 

"A critique of Metro Rail is at its core a critique of the urban form it serves – low density, multi-centered, and auto-reliant. But the dark side of our urban form is that it is also a spatial expression of racial and economic apartheid, L.A. being one of the most segregated cities in the United States, created by the federally-financed, post-World War II exodus from the center city.”


Rhodes could have easily been speaking of Louisville, Kentucky. Like L.A., Louisville experienced a post WWII exodus from the central core, as affluent whites moved to new subdivisions and neighborhoods eastward. Like LA, Louisville is building a low density, multi-centered urban sprawl, that neglects core assets and increases auto dependence, placing more economic pressure on low income residents who are losing mass transit alternatives to jobs and marketplaces in the far east end.  

Along with the development and transportation policy that are bleeding the vitality out of the urban core, the drug war and collapse of the black west end economy are throwing  too many under educated and un-connected people out of jobs and into the black market in drugs or other crime.  Criminalization of poor people is the result of biased economic and community development policy and is ultimately a self defeating direction where millions of dollars of community wealth are lost arresting, re-arresting and providing social welfare for broken people who cannot get a job. When the communities affected are as much as 80% black population, the coordinated policy appears to be structural racism.

Michelle Alexander argues eloquently in her book, The New Jim Crow, that mass incarceration is occurring with disparate impact on minority black communities across the U.S., resulting in a system of racial based social control.  Criminalization of large percentages of urban blacks results in joblessness and declining political power.  Mass incarceration/criminalization of Jefferson County poor people  leads to crime ridden west end streets and accelerates an exodus of professionals and working people from the areas. Developers have obtained inordinate infrastructure development in the far east county for new urban centers leaving the black, urban core as a ‘throw away’ city.

“This is the crime of which I accuse my country and my countrymen, and for which neither I, nor time nor history will ever forgive them, that they have destroyed and are destroying hundreds of thousands of lives and do not know it and do not want to know it . . . it is their innocence which constitutes the crime . . . This innocent country set you down in a ghetto in which, in fact, it intended you should perish.”


James Baldwin, The Fire Next Time


Social Justice,

and Urban Form


Ongoing racial inequalities are recreated year after year and the capacity for self-improvement is undermined by structural racism anchored in development policy decisions that leave poor and low income people chronically isolated from energetic centers of the community. The recurrence of black poverty and criminalization in specific neighborhoods year after year in Louisville is a manifestation of racialized public policies and institutional practices that must be abandoned. The wasted energy and economic wealth of maintaining racial and income disparity is unsustainable. Systemic exclusion from self-improvement is nothing new:


[S]ignificant numbers in the current generation of adults of color, along with their parents, grandparents, and other forbears:


        • came from a background of slavery or labor exploitation;

        • were limited by de jure or de facto segregation;

        • were generally confined to jobs in areas such as agricultural, manual, or domestic labor, and excluded from jobs that allowed them to accumulate savings and retirement benefits;

        • were discriminated against by lending institutions and were excluded from owning homes in economically desirable locations through redlining and other policies.


In other words, at pivotal points in U.S. history when socioeconomic factors produced abundant opportunities for wealth and property accumulation—such as the G.I. Bill and home mortgage subsidies—white Americans were positioned to take advantage of them, whereas Americans of color were systematically prohibited from benefiting from them.”


Structural Racism and Community Building,

Aspen Institute Roundtable on Community Change, 2004 p 16.


Change in Louisville will require a plain statement of mission to reverse course and stop shooting ourselves in the foot. Plain speaking about the failed development policies that continue structural racism need expression at the highest leadership levels. These are the same failed policies that destroy environmental quality, blow criminal justice system budgets, and lead to ballooning health care and social welfare costs. Re investment in the core urban area and connecting poor communities with jobs through mass transportation must be priority now that millions have been wasted on basketball arenas and smoke filled great lawns.

Google satellite view of Jefferson County Kentucky shows the grey, paved and built up area of the old urban core mostly west of I-65 running north-south through the map.  East of the outer ring, and miles from MSDs major treatment facilities, 26,000 acres are deemed suitable for development as the county population in the Floyds Fork watershed increases to 200,000.  As shown below, development in the east county steals precious community funds necessary to revitalize and address the social ills that decades of failed policy have produced.  Louisville must develop limits on outer county development and refocus on building a vibrant multi-ethnic community in downtown and the west end.  New development ideas, new jobs for blue collar low education people, and new mass transportation corridors using fixed rail, will produce an exiting, prosperous urban environment where green space is integrated and improved. The future lies in joining the divided city and discovering a treasure of black creativity now buried and wasted.


A zoning change announcement in the green fields of east county along Bardstown Road where new affluent, auto-dependent residential and commercial developments are being built in new urban centers. The Floyds Fork Area Study omitted growth north of Shelbyville Road.

(excerpted from)

K’Meyer, Tracy, “The Gateway to the South,” Ohio Valley History, Vol. 4 No.1, pp 43- 59, Spring 2004,

Filson Historical Society


“At the end of World War II, Louisville remained a segregated border city, but one that had begun to experience the economic, political, and social changes that would reshape its race relations. According to the 1950 census, since the start of the war, the city's population had grown by nearly sixteen percent to 369,000, of whom 15.7 percent had been classified by census officials as "nonwhite."


That population was becoming increasingly segregated following white flight to the suburbs that began in the 1930s and accelerated in the 1950s. As a result, African Americans became concentrated in the oldest and most crowded sections of the city's west end.


The population growth resulted in part from an expansion of war-time defense industries that drew workers to the city, a resurrection in the local economy that began in Louisville's chemical, plastics, and munitions factories. This expansion continued after the war so that, by 1950, thirty-one percent of the population worked in manufacturing. African Americans, however, did not share equitably in the new jobs. A study by two social scientists at the University of Louisville showed that in 1950 sixty-two percent of white men worked in white collar,

skilled or supervisory positions while the same percentage of black men labored in service jobs or unskilled positions.  Hence, these manufacturing plants helped shape not only the city's economic growth but, indirectly, its racial climate.”


“As early as 1963, Hunter Thompson wrote that Louisville had  "integrated itself out right out of the South" and that it now "faces problems more like those of a northern or midwestern city. "  The public accommodations law had eliminated a problem that most obviously identified Louisville, to use an earlier phrase, as "southern in its approach to the Negro."


However, between the passage of the local civil rights ordinance in 1963 and the open housing conflict in 1967, riots in northern and western communities had drawn attention to problems of overcrowding in slums, job discrimination, and police brutality. These issues became identified as "northern," and thus a new negative racial reference was added to Birmingham: Harlem.


Soon Louisville activists began to identify similar problems in their city and used the northern references as a warning. Black leaders asserted that Louisville's schools had begun to re-segregate by way of white flight to the suburbs, the West End was becoming overcrowded and sinking into slum conditions, black residents faced growing employment discrimination as jobs moved to the south and east ends, and incidents of police harassment were increasing.


The West End Community Council vacillated between an optimistic and pessimistic rendering of the situation. At times it argued that as a border city, Louisville could lead the way out of these problems for both regions. But at other times it warned that without progress, Louisville "will simply move from the old problems of the South to the frightening racial problems of the North. " 


Others argued that Louisville needed "to learn the lessons from other cities where there have been outbreaks of racial violence" such as Cleveland, Watts, or Harlem. Indeed, in late May 1968, a month after riots ravaged American cities in the wake of the assassination of Martin Luther King, Louisvillians learned that it could "happen here."


For four days, Louisville suffered from a civil disturbance stemming from anger over a police harassment case and simmering frustration over continued housing and job discrimination.”  (Citations omitted.)

Black males make up just 10 % of the Metro Louisville population but, Metro Corrections annual statistics for 2012 show they make up 33 % of average daily arrestees and for various reasons they are retained in custody at a higher rate than whites. The Louisville leadership (more focused on cutting business deals in the east county region), seems to have a hard time connecting desperate poverty with resulting crime. After 145 years of racist discrimination since slave emancipation, Metro Louisville seems to be determined to add more police officers to increase

enforcement rather than adding investment to create jobs.

U of L police Lieutenant David James, a former Fraternal Order of Police leader and LMPD officer, now Councilman for District 6 is proposing to increase the number of police officers, even though

public safety now swallows up 55% of the total Metro

budget. David James should be demanding to know

the truth about the Jay Morgan case. Did insider deals

stop a FORD training center from being located in

West Louisville? Blue collar jobs and training is what  

will bring peace in the streets.


Top: December 2010     Bottom: July 2011

July 2011                                                                                               July 2011

December 2010                                                                                      December 2010

THE URBAN CORE

The built up, urban core of West Louisville shows gray on this Landsat Google Map with rural greenfields in the Floyds Fork watershed to the east. West of I-65 running North - South, the old urban core neighborhoods, once vibrant, have been walled off by security fenced industrial acreage, rail yards and highways. Inside, poverty and joblessness are leading to higher crime rates and more police action. Auto-dependent transportation policies expressed by far flung industrial workplaces, shopping centers and marketplaces beyond walking distance and not well served by TARC bus service, confine low income residents to local resources and job opportunities. The result is poor young men and women looking for survival in crime ridden streets. The predictable outcome is that young people will band together in supporting groups, called ‘gangs’ to fill the economic gap. Long term, gang activity as a form of resistance to perceived oppression and racism , is elevated to defining social identity. Hardened criminal attitudes and repeated jail time produce an almost intractable social problem.

Long in the making, change will require a coherent, consistent program to equalize job opportunities across the county, connect isolated poor people with work by mass transportation and refocus heavy economic development into compact brown fields associated with progressive urban community designs. There is no guarantee that any of this will occur.

FLOYDS FORK ACTION PLAN

MSD is seeking approval of its 30 year plan for installing and expanding the sewer collection and treatment system in Floyd Fork. The agency predicts the wateshed population will increase by 2030 from 150,000 today to 200,000. MSD has charted 26,000 acres of land in the watershed suitable for development. Multiple 30 million dollar projects to create miles long and massive sewer trunk lines to convey sewage across the long distances of the east county to treatment is a massive squandering of community wealth to serve developers. Creating multiple urban centers around the outer ring of Louisville, while the core rots, is dysfunctional public policy and will result in unsustainable loss of blood, natural lands and money.

Development is progressing eastward, converting greenfields beyond the Gene Snyder beltway into shopping centers and gated communities. Double click on the map and use the zoom bar to explore the west end up close. No reliable, timely, mass transit alternatives connect the poor in the west to jobs in the affluent communities of the east. You can see Floyds Fork running north to south at the extreme right hand side of the map.

Like LA, our regional form is now groaning under functional inefficiencies:

Sprawl (excessive travel distances and times),  Excessive infrastructure costs ($ 840 million dollar sewer repair) Limited job access for the poor  (no TARC service to jobs in the east) Increasing pollution (air, land and water) reduced quality of our living and natural environment  (severe lack of visual coherence, and the "despatialization" of the region and its natural setting into the abstraction of plotted parcels administered by planning bureaucracies)  and a resulting “calcification of a landscape of inequity and segregation " elsewhere deemed structural racism and an aspect of ‘New Jim Crow’ policies aimed at keeping the white elite at the top of the economic heap.


Predatory policies in housing and lending in the private economy find a correlate in the negligent and destructive social and political policies put forward amid a PR blitz about “opportunity city” and touted at ‘bread and circuses’ events along the waterfront in the steaming days of the long hot summer. This county is divided and the division is growing.


The only solution for runaway criminal corrections budget, disproportionate arrest statistics and exploding vacant and abandoned properties, is a program of economic vitalization to bring improved public transportation and broad economic development in the west end.

July 2003  Report

NATIONAL ACADEMY OF PUBLIC ADMINISTRATION  

For the U. S. Environmental Protection Agency

ADDRESSING COMMUNITY CONCERNS:   HOW ENVIRONMENTAL JUSTICE

RELATES TO LAND USE PLANNING AND ZONING


“Environmental and land use planning agencies at federal, state, and local levels

must integrate achieving environmental justice into their missions and make

implementation a part of their core program activities.”


“Environmental justice is the fair treatment and meaningful involvement of all

people regardless of race, color, national origin, culture, education, or income

with respect to the development, implementation, and enforcement of

environmental laws, regulations, and policies.”


Fair treatment means that no group of people, including racial, ethnic, or

socioeconomic groups, should bear a disproportionate share of negative

consequences resulting from industrial, municipal, and commercial operations

or the execution of federal, state, local, and tribal environmental programs

and policies.


Meaningful involvement means that:

  1. (1)potentially affected community residents have an appropriate opportunity

to participate in decisions about a proposed activity that will affect their

environment and/or health;


(2) the public’s contribution can influence the regulatory agency’s decision;


  1. (3)the concerns of all participants involved will be considered in the decision-

making process; and


  1. (4)the decision-makers seek out and facilitate the involvement of those

potentially affected.


  1. Addressing environmental justice concerns is a basic duty of good

government because protecting the health and welfare of the public is

the primary responsibility of effective public administrators.


  1. Leadership and accountability for reducing risks and enhancing

meaningful public engagement are needed at every level of government

to develop solutions to environmental justice problems.


  1. Government at every level has not always been proactive in addressing

environmental justice concerns and citizen protest has often been the

catalyst that prompted government action.


  1. There are many legal and regulatory authorities for federal, state, and

local officials to use when addressing environmental justice concerns,

but they are not being fully or creatively utilized.


  1. More effective coordination is needed between all three levels of

government because each level can contribute legal authorities,

technical expertise, and practical administrative tools needed to

address current environmental justice problems and prevent future ones.


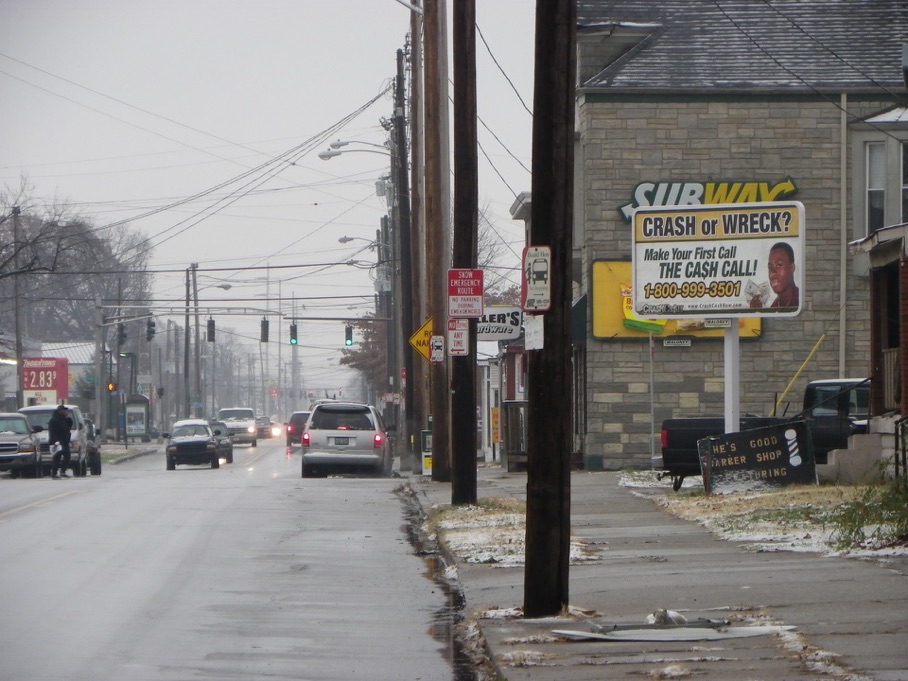
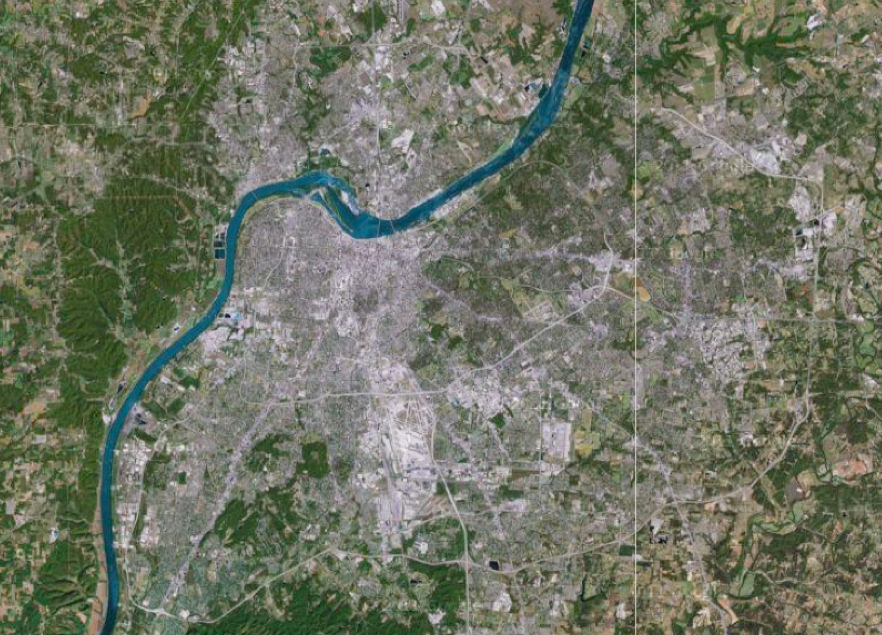
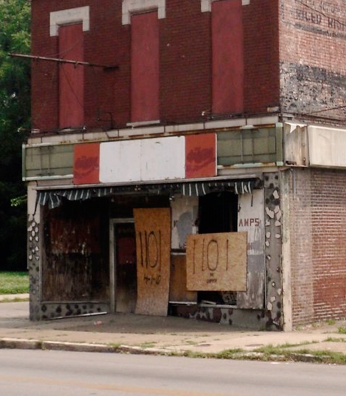
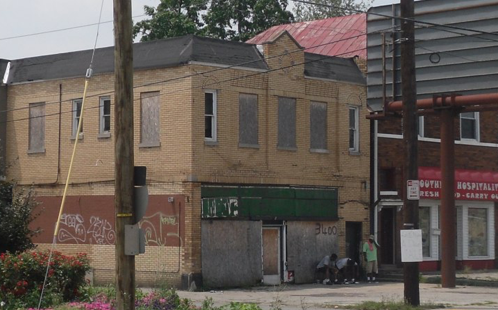
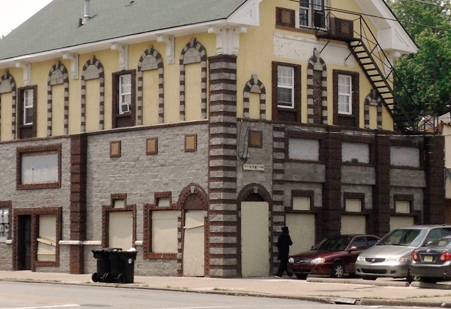
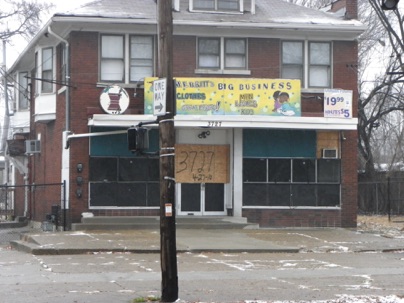
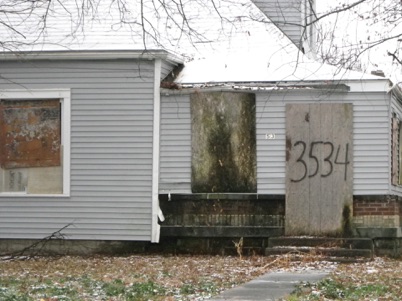
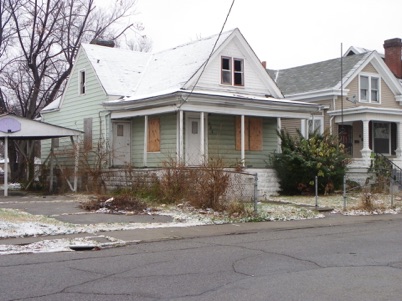
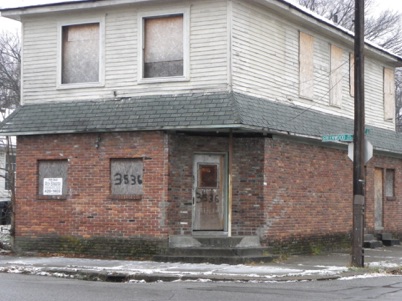
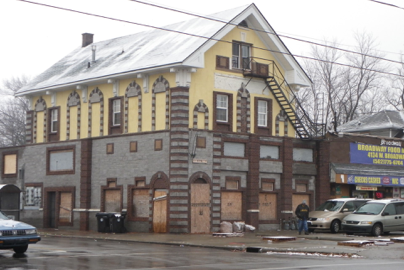
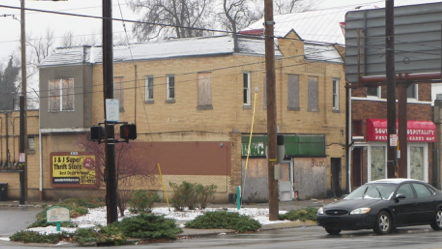
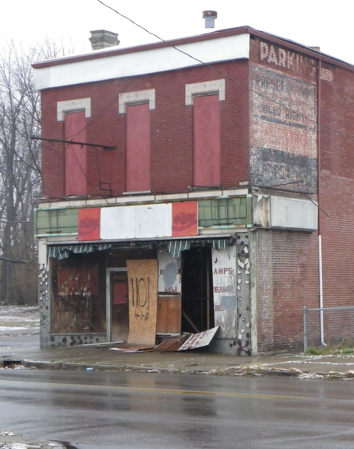
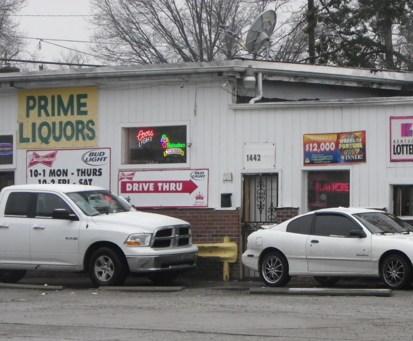
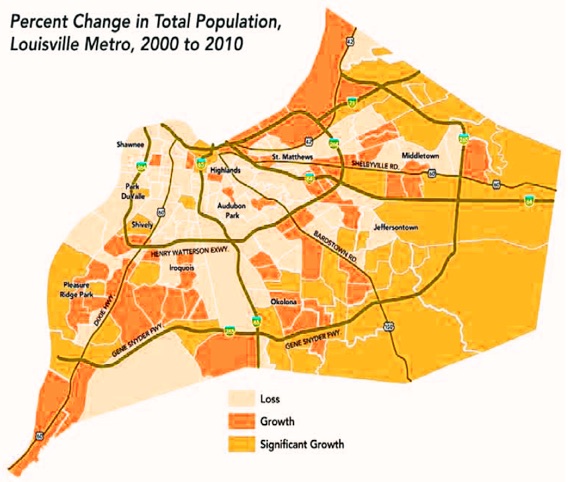
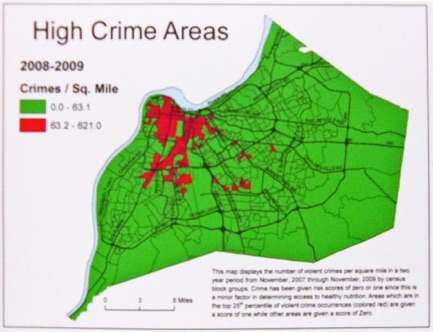
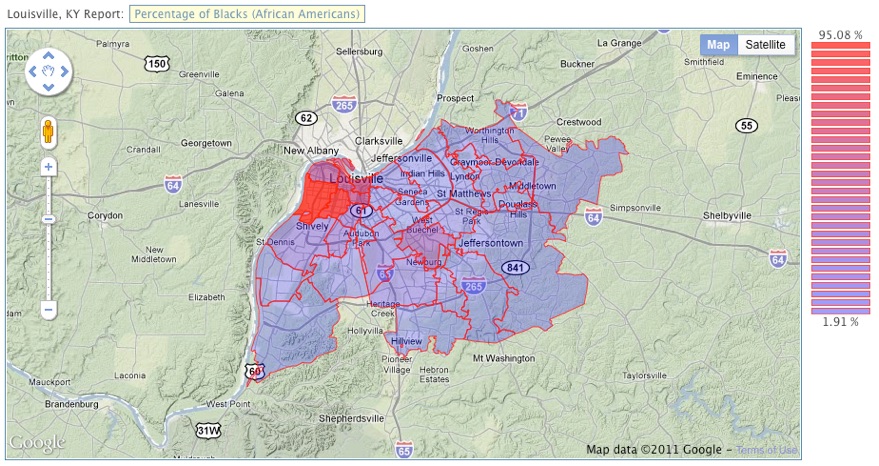
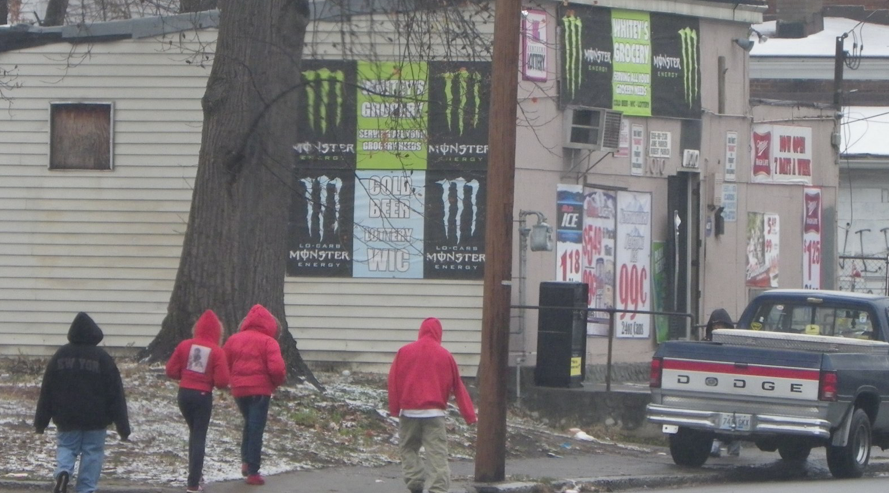
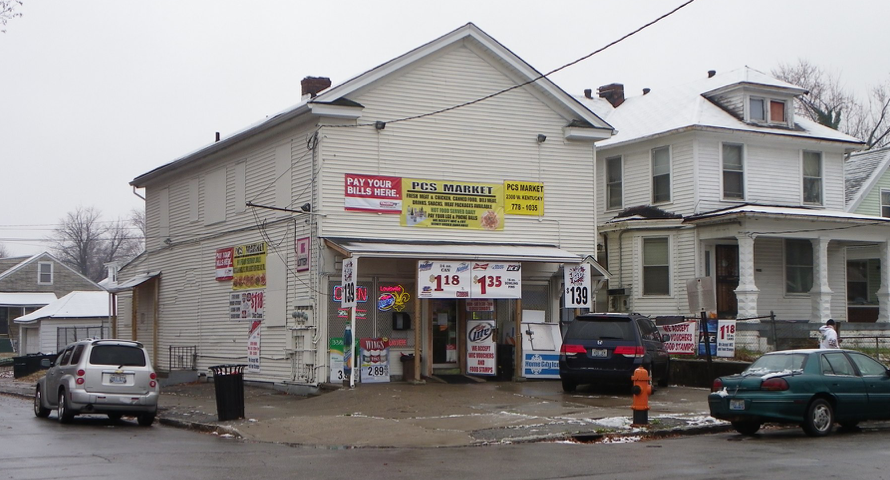
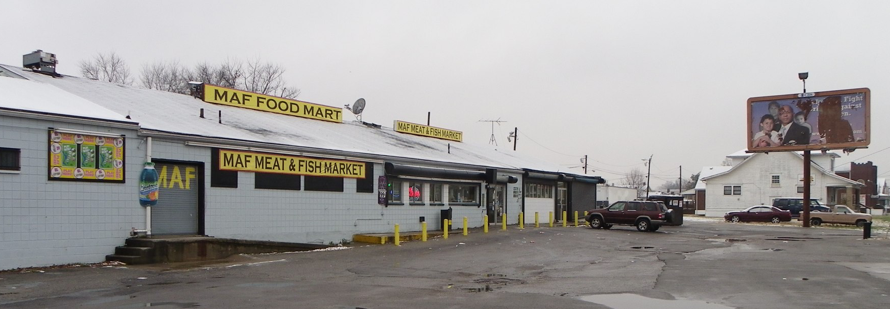
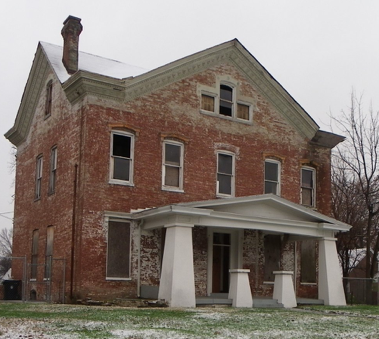
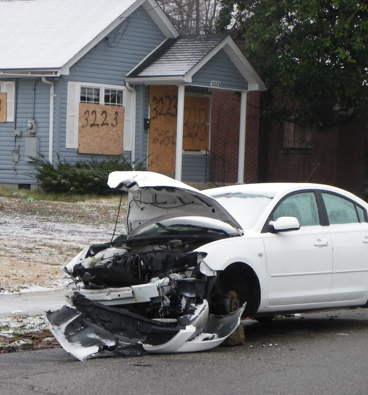
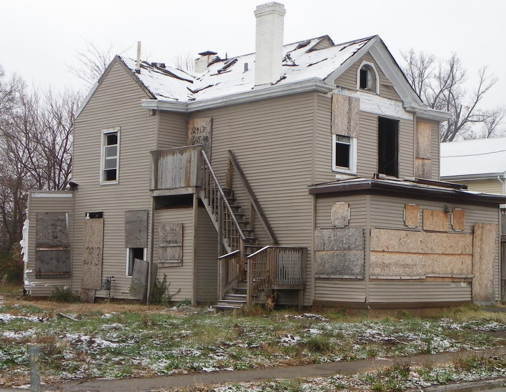
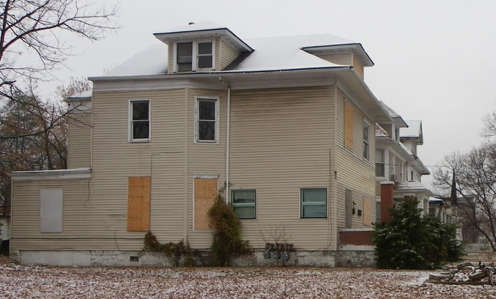
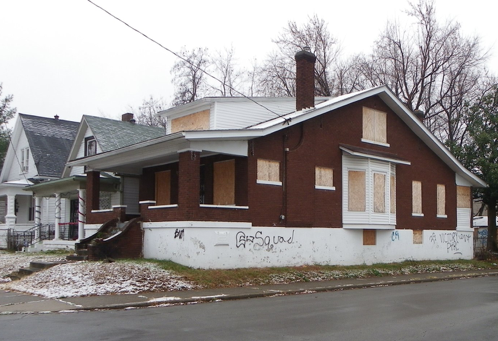
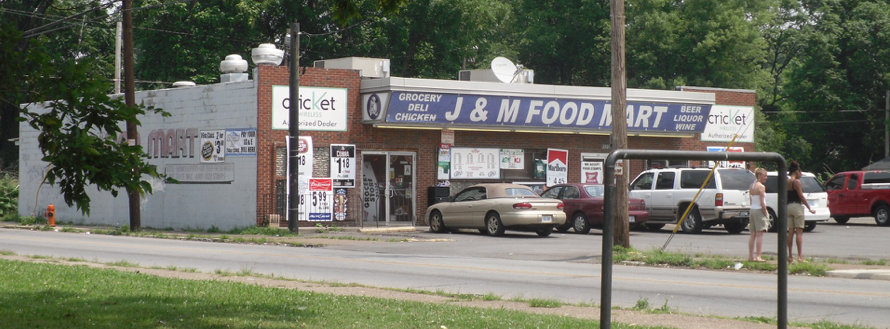
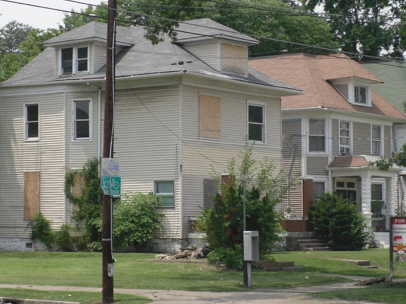
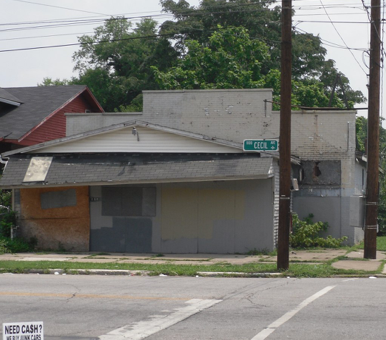
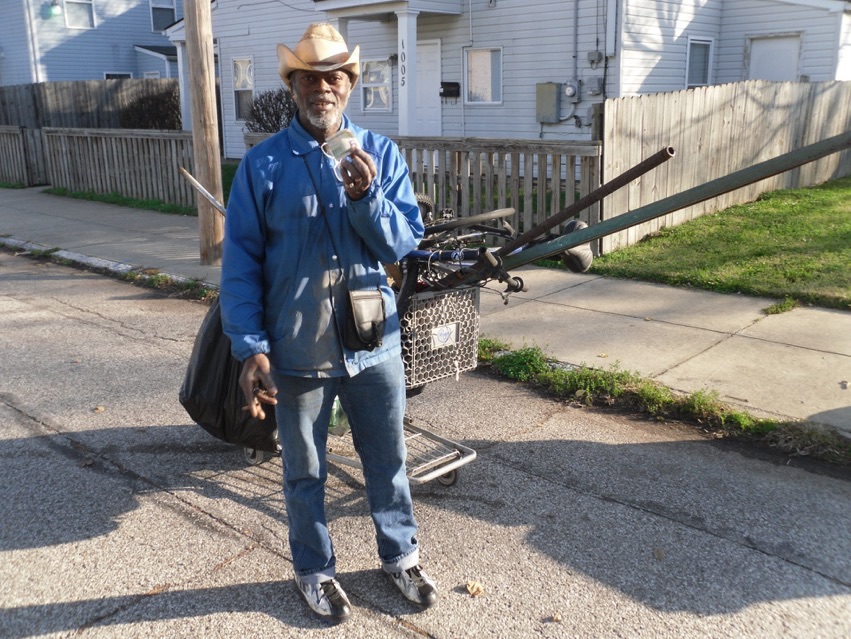
Despite growing awareness nationally  of the connection between land use

and social justice, white flight continues  unabated in Metro Louisville and

the ring counties. Louisville’s calcified  history of racial inequity, preserved in its land use and economic development policies, is used as subject material  for college level social justice and  environmental health classes.


Louisville Bridges Project $ 1.12 billion dollar east end bridge will spur population growth in the  east county where population is expected to go from 129,000 today to 200,000 by 2030.


Many millions will be spent by MSD to install increased treatment plant capacity and major sewer system connections in the Floyds Fork watershed over the next 30 years to serve sprawl growth.


Business leaders are developing new urban centers  in the predominantly white, upper income,  east end, while African American children languish in urban streets filled with poverty, crime and joblessness in West Louisville.


Racism in Louisville is accomplished --not by rednecks wearing white sheets, but by educated men and women of pleasant demeanor. They are council persons and business leaders, black and white, who exploit economic development resources to develop the east end while poverty, joblessness, and social isolation, create crime and family disintegration in the west end. 

2011 METRO BUDGET

POLICE  $ 152.7 million

JAIL        $  50.7  million

Juvenile  $ 10.26 million

EMS       $  20.82 million

CJC        $  11.2   million


55.6% Total Metro Budget


Environmental Justice Tour: Louisville,

KY November 12, 2010

By Mainerd Sørensen


“The tour guide was Tim Darst from  the Earth and Spirit Center organization  of Louisville. The purpose of the EJT  was to promote awareness of the  distribution of environmental hazards into  areas of the city predominantly populated by people  of color and lower  socioeconomic status. It is a

social justice issue that people with less resources  and potentially less participation in government,  for a variety of historic and economic reasons, bear  the burden of what is essentially pollution produced in  the advancement of the economy of the region.  A slide show and commentary provided an introduction  to the city and helped one visualize - from the “bird's eye”  view - the juxtaposition of neighborhoods and

industrial sites.”


see,

<http://eh.uc.edu/erc/blog/index.php?q=node/3>


The City

The tour began with a drive down Broadway and noting

the dramatic change in the appearance of conditions as

we passed from the affluent East Side of Louisville near

Bellarmine, to the lower income West End. 


See, Bellarmine Students for Social Justice webpage

<http://rso.bellarmine.edu/ssj/>


Dr. Overbey explained that Louisville’s West End used to be where everyone lived (all races), the center of life for the city. In the 1930s, most people used the trains to get around the city. He said that after World War II, residents were encouraged to use private automobiles for transportation and eventually the train station was closed. He added that the Civil Rights Act of 1964, which promoted desegregation, ironically caused some more affluent whites to move to the East End and the black population and economically disadvantaged residents remained in the West End; the Hispanic population settled mostly in the South Side.


History of West End Louisville Industry

In 1918, the petrochemical industrialization began in west Louisville with the construction of a Standard Oil refinery (now Chevron terminal and tank farm). Over the next two decades additional refineries were built and purchased by Ashland Oil. World War II created a demand for rubber for the construction of military aircraft and tanks. Under the supervision of the US Office of Production Management, the government either built synthetic rubber plants or purchased them from their original owners, investing $92.4 million in Louisville. The first plant to be built was National Carbide in 1941, which used limestone and petroleum coke to produce acetylene gas. The acetylene gas was used as feedstock at a neoprene synthetic rubber plant built by E.I. DuPont de Nemours & Co. that same year. Also in 1941, BF Goodrich began construction and then produced a synthetic rubber made from vinyl chloride, called Koroseal. Other companies such as Goodrich joined in making various types of “nitrile” rubber from acrylonitrile, butadiene, and styrene. When WWII broke out in December of 1941, the government took over the DuPont plant. In 1943, the federal government opened what is now the American Synthetic Rubber Plant to make styrene-butadiene rubber tires to be used by the Department of Defense. Rubber was used for tires and vinyl for seats. The west end area of Louisville became known as “Rubbertown.”

The west end is well served by liquor stores and tort lawyers.

Gallery of Foreclosure

Tort law and alcohol in underserved communities

Tackling Disproportionate Minority Confinement:

An Evaluation of Louisville Metro’s Efforts to Reduce DMC Using the Burns Institute Model


Georgiana Hernández, Ed.D.

Matthew S. Fitzgerald


“IN 2003, LOUISVILLE-JEFFERSON COUNTY METRO (Louisville Metro) launched a DMC reduction initiative with technical assistance from the W. Haywood Burns Institute (BI), a national leader in the field of juvenile justice reform. Louisville Metro was the ninth jurisdiction in the country to implement the BI model, designed as a three-year initiative to build jurisdictions’ capacity to reduce disproportionate minority confinement (DMC). The goal of BI’s DMC reduction model is to build jurisdictions’ capacity to address the problem of overrepresentation of youth of color in the juvenile justice system.


Louisville Metro officials were aware they had a serious DMC problem.


In 2003, 1,701 youth were detained in Louisville Metro’s Youth Detention Services.


As shown in Exhibit 1, 62 percent of those detainees were African American, despite the fact that African American youth made up just 25 percent of the youth population in Louisville Metro.” [less than 25% males]

“Louisville Metro Government received an initial one-year grant and two subsequent renewal grants from the Kentucky Department of Juvenile Justice to implement the BI model with technical assistance from BI staff. BI staff. The DMC Initiative began in July 2003, with BI staff providing on-site and on-call technical assistance. Although the initial technical assistance contract with the Burns Institute ended in June 2006, the Department of Juvenile Justice continued through 2008 to contract with BI for a more limited level of technical assistance as Louisville Metro pursued its strategies to reduce DMC.”


Page 45


“What was frustrating to some stakeholders, however, was the fact that Louisville Metro’s overall levels of DMC did not drop. Despite making progress on many of

the strategies implemented, the collaborative saw DMC levels actually increase, with African American youth constituting 62 percent of detained youth in 2003 and 70 percent in 2009, while representing just 25 percent of the youth population in Jefferson County. As shown in Exhibit 13, only in 2004 did the number of African American youth in detention drop below the number detained when the Initiative began its work in 2003. This reality notwithstanding, we offer the view, as did numerous stakeholders we interviewed, that addressing DMC is an ongoing process that requires a long-term, sustained commitment.”

Graphics of Louisville Kentucky Juvenile Detention from:

Tackling Disproportionate Minority Confinement:

An Evaluation of Louisville Metro’s Efforts to Reduce DMC Using the Burns Institute Model


Georgiana Hernández, Ed.D.

Matthew S. Fitzgerald

Louisville Metro Department of Corrections

Fact Sheet 2011


Intake

Annual Bookings: 43,411


Average Bookings per Month: 3,618

Average Bookings per Day: 119

Top Booking Day of the Week: Wednesday

Number One Arresting Agency: Louisville Metro Police

Number Two Arresting Agency: Jefferson County Sherriff


Most Common Charge at Booking: Traffic

Second Most Common: DUI

Third Most Common: Theft


Population

Rated Detention Capacity: 1,793


Average Daily Population:

Detention: 1,992

Home Incarceration: 525

Day Reporting: 34

Total: 2,551


Average Length of Stay in Detention:

20.02 days   Inmates: 44,879

Jail Complex: 15.3 days Inmates: 36,800

C.C.C.: 59.03 days Inmates: 3,079

H.I.P: 57.68 days Inmates: 3,275

Average Daily Number of Inmates on Work Release: 226


Average Number of Participants in

Misdemeanant Intensive Program: 311


Classification of Inmates:


Minimum: 23%

Low Medium:

59% High Medium: 13%,

Maximum: 1%,

High Maximum: 1%

PC: 0%

Administrative Seg: 0%

Disciplinary Seg.: 3%


Population Demographics:

BOOKING:


White Male: 41%,

Black Male: 34%,


White Female: 14%,

Black Female: 8%

Hispanic Male: 2%,

Hispanic Female: .27%,

Other Male: .28%,

Other Female: .08%


IN CUSTODY:


White Male: 36%,

Black Male: 48%,


White Female: 7%,

Black Female: 5%

Hispanic Male: 3%,

Hispanic Female: .0%,

Other Male: .1%,

Other Female: .1%

Kentucky and Louisville Crime rates

2009 Statistics collected by the Henry Kaiser Family Foundation at

<http://www.statehealthfacts.org/profileind.jsp?ind=6&cat=1&rgn=19> list blacks as 7% of the total population in Kentucky at 308,900.   41% or 125,600 of those people are living below the poverty line. That compares to 35% below poverty in the national population.


Mass Incarceration and the cycle of poverty

The so-called “war on drugs” was officially declared by President Reagan in 1982, although it had started earlier under the pressure of public concerns about drug abuse. The label “war” is appropriate, for it has involved very aggressive law enforcement, very harsh punishments, and an absolute horde of prisoners. It would be difficult to overstate the “war’s” contribution to the nation’s inmate population, which now stands at 2.31 million, the highest in the world:

The number of people in jail and prison for drug law violations increased from 50,000 in 1980 to almost 500,000 today. That total is greater than the total number of people incarcerated for all criminal offenses in western Europe (whose population exceeds that of the United States by roughly 100 million).

See the article, Prof. Robert Lawson,  Drug Law Reform, Retreating from an Incarceration Addiction, Vol. 98 No. 2, Kentucky Law Journal

page 201. Download as .pdf:        click HERE


In the early 1970s, the state had about 3000 inmates in custody,  had two prisons for men and a small prison for women,  and had a corrections budget of no more than $10 million.


In the spring of 2008, the state had an inmate population of 22,719  and a very substantial and growing number of drug offenders within that population, owned and operated thirteen state prisons and had inmates in three private prisons, and had a corrections budget of about $450 million.


Under the pressure of a budget crisis of unprecedented proportions, the state has used an early release program (under its power over parole) to reduce the inmate population by about 1000,  so that by mid–year 2009 it had in custody 21,565 inmates  (about seven times as many as it had at the outset of its war on drugs).”

“The African-American community represents the largest segment of the Louisville minority population and is concentrated in two areas of the community; the Northwest and the South Central areas of Jefferson County


West Louisville . . . is characterized as one of the most economically depressed urban neighborhoods in the United States

(Jefferson County 2007).


According to the 2000 US Census,  90,110 people live in the West Louisville area.   The poverty rate in West Louisville is 42% compared to the regional average of 12.4% (Census 2000).  The childhood poverty level in West Louisville (48%)  is triple the rate in the Greater Louisville Metro area and the US (18.5% and 16.6%, respectively).”


Highest rate of uninsured (25%)

Highest rates of cardiovascular disease (50%)

Highest rates of death due to lung cancer (75%)

Rate of stroke is disproportionately higher than the rest of Kentucky

High prevalence of adults smoking

Highest infant mortality

High rates of low birth weights

Highest number of children with lead levels above recommended levels


<http://louisville.edu/environmentalgenomics/community-outreach-and-education-core-coec/targeted-populations.html>


Louisville Metro Health Status Report  2009

Dr Adewale Troutman MD, MPH, MA


Causes of Death 2006 in Metro Louisville


African American rate was 39% higher than white population rate

1,255.6 per 100,000            versus          900.7 per 100,000 white

Lung cancer death rate for African Americans (112.7 per 100,000) was almost twice the rate for Whites (61.9 per 100,000) For African Americans, death rate from diabetes was twice the rate for Whites. The homicide death rate for African Americans was more than 7 times that of Whites.


Kentucky State Police Arrest Statistics for Kentucky and Jefferson County


Numbers provided in response to Open Records Request on 9-26-2011

2011 numbers accurate to 9-23-2011

All Jefferson County Drug Arrests by race


YEAR        WHITE      BLACK      ASIAN       BLACK % total


2008            4315           4441            15                50.7   %

2009            4138           4726            20                53.3   %

2010            5120           4850            23                48.64 %

2011            3729           3105            24                45.43 %


All Jefferson County Marijuana Arrests by race


2008            3006           3002            14                49.9   %

2009            3198           3443            16                53.4   %

2010            3592           3555            14                49.7   %

2011            2206           2172            18                49.6   %


All Jefferson County Cocaine Arrests by race


2008            613           1173               0                65.67  %

2009            491           1146               2                70.0    %

2010            425             851               2                66.7    %

2011            308             522               3                62.89  %

Kentucky statewide arrests of males for all crimes by race


YEAR            ALL         BLACK          BLACK % total


2008            167,527          26,114                15.58   %

2009            174,340          29,664                17.01   %

2010            168,057          29,583                17.60   %

2011            111,732          20,136                18.02   %


Jefferson County arrests of males for all crimes by race


2008            12,539             4972                  39.65    %

2009            22,190             9124                  41.11    %

2010            21,969             9389                  42.73    %

2011            15,588             6593                  42.29    %


U.S. Census Data


Kentucky statewide % population black      7.8     %


Jefferson County  %    population black    20.8     %

Louisville  spends far too many millions felonizing people of color, depleting the treasury to arrest, punish and confine people, who are desperate to put food on the table in a world for which they are undereducated, under-trained  and unemployable. Structural racism has to be addressed by Metro government  directing economic revitalization to provide jobs and public transportation.


“Based upon data reviewed for Louisville Metro, it is evident that the returning prison population is not evenly distributed across the community.

In keeping with the national trends cited above, 48% of the individuals released from prison to supervision reside in just six zip codes containing only 22% of the general population. Similar patterns are seen with those offenders who serve out their sentences.It has been suggested that incarceration loosens family connections, which subsequently reduces the effective-ness of these controls to act as agents of socialization. It has also been theorized that incarceration may negatively affect the economic and political institutions of a community. As incarceration rates climb in a community and prisoners start to return home, moral authority is

increasingly invested in those for whom criminal behavior is a way of life.

The attitudes, behaviors and lessons learned in prison become more prevalent and are transmitted to the community as a whole. Neighborhoods become more vulnerable to a variety of social ills such as drugs, unemployment, family disorganization and more crime.”


2005 Louisville Metro Justice Re-investment Project Final Report

Gallery of Economic Disinvestment