The Bridges project has been criticized as extending the dependence of the local commuting population on the 50s era design of single occupant vehicles cruising down concrete highways. Enormous concrete roadways are impervious surface and collect roadway pollutants such as cancer causing chemicals and toxic heavy metals from brake drum wear and tire abrasion. These pollutants are washed off in storms to local waterways--in the case of the East End Bridge, to Harrod’s Creek. Although, the FHWA approved bridges plan alleges there will be no direct runoff to the well head protection area of the Louisville Water Company’s artesian well intake area, that claim appears to be false, and the ‘best management practices’ method of dealing with road runoff toxics amounts to little more than direct discharge of partially settled water. Some solids will be removed by settling in a collection tank, but chemicals in solution will flow into Harrod’s Creek at the River Road crossing where the bridge runoff is discharged. EPA comments to the Revised Rule of Decision urged the bridge design be upgraded to handle 500 year storm volumes --but FHWA declined.
See Comment/ Response reprinted below--
In response to a comment to the SFEIS, asking that Greenhouse gas emission of the Bridges Project be evaluated in the Supplemental Final Environmental Impact Statement, FHWA responded on page 687 of the .pdf document otherwise designated as page 7-86.
F.10
CEQ issued draft guidance for public comment on, among other issues, when and how Federal agencies must consider greenhouse gas (GHG) emissions and climate change in their proposed actions:
http://www.whitehouse.gov/sites/default/files/microsites/ceq/2O100218nepaconsideration-
effects-ghg-draft-guidance.pdQ
While this guidance is not yet final (and thus, not required) it is recommended that the assessment explicitly reference and describe the elements of the draft guidance, and to the relevant extent, provide the assessments suggested by the guidance. Project sponsors should thoroughly consider the need for measures to manage potential climate-related impacts due to expected increases in storm frequency and intensity, such as increased floodwater flows and needed drainage capacity in the design of this project.

Bridges Project deemed by FHWA
too small a contribution to emission
of global warming gas to rate analysis
Carbon dioxide is ruled a NAAQS pollutant by District of Columbia Court of Appeals
In a June 26, 2012 decision, the federal appeals Court in Washington DC ruled :
Opinion for the Court filed PER CURIAM.
PER CURIAM:
Following the Supreme Court’s decision in Massachusetts v. EPA, 549 U.S. 497 (2007)—which clarified that greenhouse gases are an “air pollutant” subject to regulation under the Clean Air Act (CAA)—the Environmental Protection
Agency promulgated a series of greenhouse gas-related rules.
First, EPA issued an Endangerment Finding, in which it
determined that greenhouse gases may “reasonably be
anticipated to endanger public health or welfare.” See 42 U.S.C. § 7521(a)(1).
Next, it issued the Tailpipe Rule, which set emission standards for cars and light trucks.
Finally, EPA determined that the CAA requires major stationary sources of greenhouse gases to obtain construction and operating permits.
But because immediate regulation of all such sources would
result in overwhelming permitting burdens on permitting authorities and sources, EPA issued the Timing and Tailoring
Rules, in which it determined that only the largest stationary
sources would initially be subject to permitting requirements.
Petitioners, various states and industry groups, challenge all
these rules, arguing that they are based on improper
constructions of the CAA and are otherwise arbitrary and
capricious.
But for the reasons set forth below, we conclude:
1) the Endangerment Finding and Tailpipe Rule are neither
arbitrary nor capricious;
-
2)EPA’s interpretation of the governing CAA provisions is unambiguously correct; and
-
3)no petitioner has standing to challenge the Timing and Tailoring Rules.
We thus dismiss for lack of jurisdiction all petitions for review of the Timing and Tailoring Rules, and deny the remainder of the petitions.
Heinz J. Mueller, Chief
NEPA Program Office
Office of Policy and Management
Climate Change Adaptation
The SFEIS states, "[regarding the design of stormwater runoff and drainage capacity, both states have developed design policies based on historical climatological data that will be adhered to when developing the final plans. Base design storm evaluations are checked on 100- year storms. "
Our climate is changing. Historical climate data will not be sufficient in predicting future storm events. 100-year storms are occurring with increasing frequency. The number of storm events occurring with greater intensity is also increasing. Designs based on historical 100-year storms may not be sufficient in the future. EPA suggests this may be particularly applicable for designing adequate handling of stormwater runoff and drainage of the proposed roadway and tunnel in order to protect the health and safety of the public who use the tunnel and roadway, or live/work near it during an intense storm event.
Recommendations: EPA recommends that INDOT and KYTC account for increased storm frequency and intensity in the design of this project in order to help insure the health and safety of the public. The ROD should commit to accounting for increased storm frequency and intensity in the design of this project.
Revised Rule of Decision Response to Comments:
USEPA-6
Climate Change Adaptations—Designs based on historical 100-year storms may not be sufficient in the future. EPA suggests this may be particularly applicable for designing adequate handling of stormwater runoff and drainage of the proposed roadway and tunnel in order to protect the health and safety of the public who use the tunnel and roadway, or live/work near it during an intense storm event. EPA recommends that INDOT and KYTC account for increased storm frequency and intensity in the design of this project in order to help insure the health and safety of the public. The ROD should commit to accounting for increased storm frequency and intensity in the design of this project.
Response by FHWA
All hydraulic design is performed in accordance with FHWA guidance and local state practices and historical data. While it is recognized that some recent events have been at higher rainfall intensities than have been on average in past years, this has also been compensated by periods of drought.
To compensate for the extremes, all major structures are designed to accommodate a 100 year storm, but are checked for a 500 year design. The storm water system that conveys water through the tunnel was also designed for a 100-year storm. The tunnel, itself, is designed with a minimum 18-inch freeboard above the 500-year flood to prevent water from entering the tunnel directly.
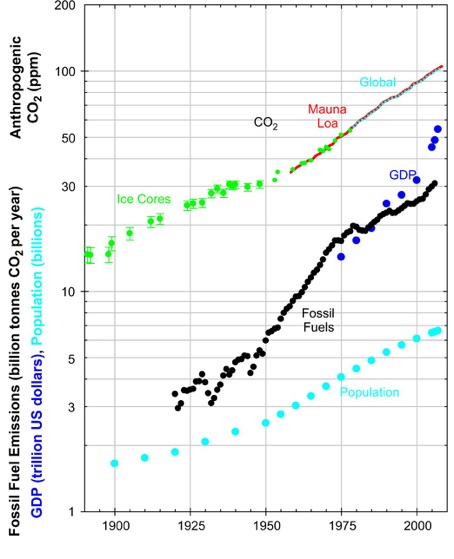
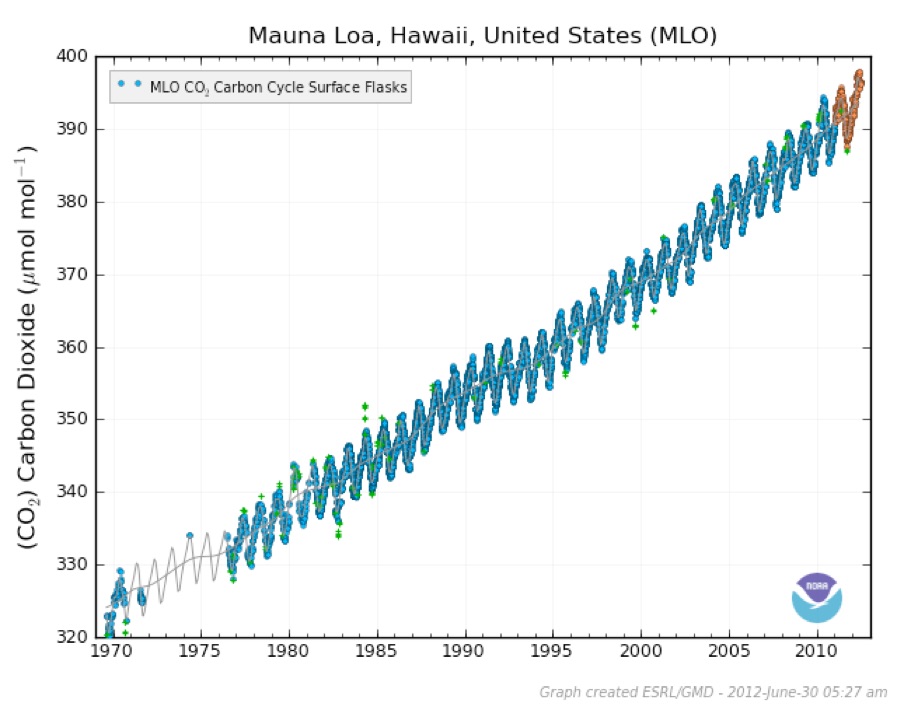
This simple graph of the Mauna Loa Carbon Dioxide Record documents a 0.53 percent or two parts per million per year increase in atmospheric carbon dioxide since 1958. This gas alone is responsible for 63 percent of the warming attributable to all greenhouse gases according to NOAA's Earth System Research Lab.
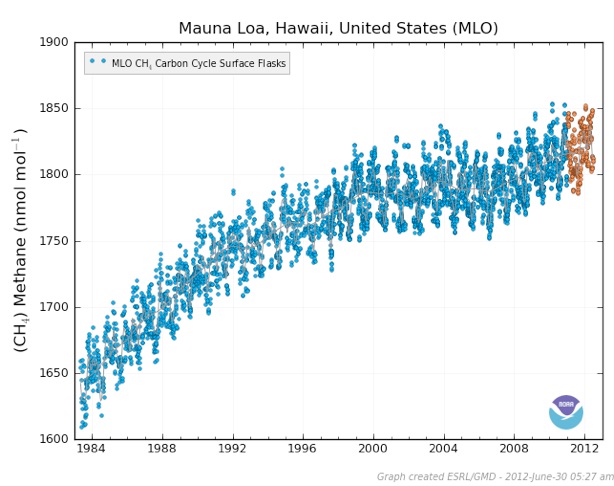
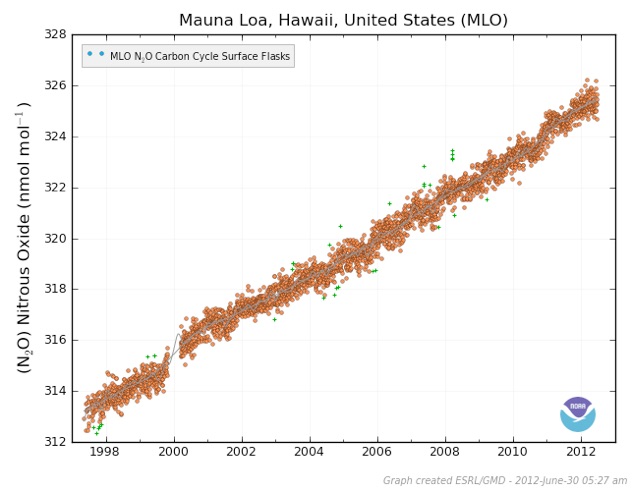
• Transport-sector CO2 emissions represent 23% (globally) and 30% (OECD) of overall CO2 emissions from Fossil fuel combustion. The sector accounts for approximately 15% of overall greenhouse gas emissions.
• Global CO2 emissions from transport have grown by 45% from 1990 to 2007, led by emissions from the road sector in terms of volume and by shipping and aviation in terms of highest growth rates.
• Under “business-as-usual”, including many planned efficiency improvements, global CO2 emissions from transport are expected to continue to grow by approximately 40% from 2007 to 2030 – though this is lower than pre-crisis estimates.
• Road sector emissions dominate transport emissions with light-duty vehicles accounting for the bulk of emissions globally. In certain ITF member countries for which estimates can be made, road freight accounts for up to 30% to 40% of road sector CO2 emissions though the breakdown amongst freight vehicle classes varies
amongst countries. Emissions from global aviation and international shipping account for 2.5% and 3% of total CO2 emissions in 2007.
• Some countries (e.g. France, Germany and Japan) stand out in that they have seen their road CO2 emissions stabilise or decrease even before the recession of 2008-2009 despite economic and road freight growth over the same period.
• The economic crisis of 2008 has led to a prolonged downturn in economic activity and has led to the sharpest drop in emissions in the past 40 years (estimates range from 3% to 10%). Depending on the strength of the economic recovery, may translate into approximately 5% to 8% decrease in 2020 emissions from their precrisis projected levels.
-
•The outcome of Copenhagen Climate Summit has not provided a strong signal supporting future emission reduction efforts for either developed or rapidly developing countries. Early analysis of both low and high ambition pledges by countries following Copenhagen finds that mitigation action is unlikely to constrain global average temperatures to less than a 2 degree celcius rise which is the threshold for dangerous climate change identified by the IPCC.
REDUCING TRANSPORT GREENHOUSE GAS EMISSIONS:
Trends & Data 2010
This document provides a brief update of GHG emission trends from the transport sector and
discusses the outcome of the United Nations Conference of the Parties to the Framework Convention on
Climate Change held in December 2009 in Copenhagen. It is based on material collected for the OECDITF
Joint Transport Research Committee’s Working Group report on GHG emission reduction strategies
which will be released in 2010. HERE
4.3.7 Transportation Summary Conclusion
Recent data with respect to climate change and GHGs necessitates a greater environmental concern in
addition to the growing societal and logistical problems of sprawl, congestion, fuel resources and related
costs. The Louisville Metro region needs a truly visionary and integrated transportation plan to meet the
current and future needs of its citizens and to augment its economic prosperity in a way that enhances
the health, vibrancy and livability of its neighborhoods. This Report with recommendations is presented
in order to provide guidance for developing this plan. See more below
Partnership for a Green City Climate Action Report April 22, 2009
Response
SFEIS Section 5.4.6, Greenhouse Gas and Climate Change, references the draft guidance issued by the CEQ. As the commenter stated, this guidance has not been finalized and, as noted in this SFEIS, while greenhouse gasses are now subject to regulation by USEPA, the regulations do not directly affect the requirements applicable to the development of transportation projects. If the CEQ guidance is finalized prior to the publication of the ROD for the project, the guidance will be evaluated to determine how FHWA should consider greenhouse gas emissions and climate change for the proposed project.
From a policy standpoint, FHWA’s current approach on the issue of global warming is as follows: On April 2, 2007, the Supreme Court issued a decision in Massachusetts et al. v. Environmental Protection Agency et al. that the USEPA has authority under the Clean Air Act to establish motor vehicle emissions standards for GHG emissions.
USEPA has undertaken a range of rulemaking activities as a result of the
Supreme Court decision, including adopting regulations establishing GHG emissions standards for light-duty vehicles (passenger vehicles and light trucks) as well as GHG emissions standards for medium- and heavy-duty trucks; in addition, USEPA is currently engaged in another rulemaking process to establish even more stringent GHG emission requirements for light-duty vehicles. 6
6 For additional information on USEPA rulemaking activities that will help to reduce GHG emissions from motor vehicles, refer to USEPA’s website at: http://epa.gov/otaq/climate/regulations.htm.
These EPA regulations will help to reduce GHG emissions from the transportation system by reducing emissions at the tailpipe. EPA has not adopted any new requirements limiting overall GHG emissions
from the transportation system, at the national, State, or regional levels. Therefore, while GHG emissions are now subject to regulation by EPA, the EPA regulations do not directly affect the requirements applicable to the development of transportation projects.7
7 The Council on Environmental Quality issued draft guidance regarding the consideration of GHG emissions in NEPA documents on February 18, 2010, but that guidance has not been finalized.
FHWA does not believe it is informative at this point to consider greenhouse gas emissions in an Environmental Impact Statement (EIS). The climate impacts of GHG emissions are global in nature. Analyzing how alternatives evaluated in an EIS might vary in their relatively small contribution to a global problem will not better inform decisions-makers. Further, due to the interactions between elements of the transportation system as a whole, emissions analyses would be less informative than ones conducted at regional, state, or national levels. Because of these concerns, FHWA concludes that we cannot usefully evaluate GHG emissions in this EIS in the same way that we address other vehicle emissions.
Partnership for a Green City Climate Action Report April 22, 2009
available for download on the Metro Government webpage
The impacts of transportation policy on human health go far beyond highly visible auto accidents to include access to health care, food services and community support services. In the absence of an adequate public transportation system, the result could be intense isolation and a widening of disparities
between car and non-car households that is likely to most seriously affect the poorest of the poor Civil rights and equity issues affecting minorities have been found to be linked to transportation policy decisions that give funding preference to projects (such as light rail and highways) that serve suburban
and/or wealthier commuters and consistently under-fund the infrastructure that is most valuable to poor and minority populations. Notably, "[i]n 1998, those in the lowest income quintile, making $11,943 or less, spent 36% of their household budget on transportation, compared with those in the highest income quintile, making $60,535 or more, who spent only 14%.”
4.3.1.1 Integrate Land Use and Transportation Planning
The promotion of compact and transit-oriented development patterns is potentially one of the most effective strategies to reduce GHG emissions from transportation in the long-term, but it also requires a great degree of collaboration among agencies and among plans. Transportation planning that considers
cross-linkages with land use plans and involves agencies with jurisdiction over those plans will ensure that transportation investment decisions support a regional vision for growth. The Louisville region needs a well thought out and coordinated transportation plan. Horizon 2030, our region’s long range
transportation plan, is simply a listing of projects sponsored by individual agencies of the local and the state governments. The Cornerstone 2020 Comprehensive Plan’s chapter titled “Mobility Strategy” addresses many of the factors identified below, but lacks the specific roles/responsibilities, priorities,
implementation activities and schedule that a strategy requires.
Recommendation 123:
LMG and KIPDA should develop a mobility strategy for Louisville. The new strategy will form the foundation of an integrated multi-modal transportation plan focused on mobility for people and freight.
4.3.1.2 Transit-Oriented Development
Well-planned communities that offer a variety of transportation options and attractive urban neighborhoods are better positioned to sustain long-term investment prospects. Cities like Austin, Denver, Madison and Chicago have programs underway that integrate economic development, transportation and land use strategies. This new type of program is an integral part of planning for a vital city. Studies in historical (traditional) non-integrated development have pointed out the sprawl that
occurs without this type of planning. In addition, “[b]y fostering or requiring low density development with a high separation of uses, Euclidean zoning is one of the great generators of suburban sprawl, with all of its environmental, economic, and social costs.”
Most development in Louisville is occurring at densities and locations that do not support multi-modal activity or mass transit. This needs to be addressed by promoting high density/mixed-use development along transit service routes to encourage reduction of vehicle miles traveled (VMT) through transit oriented development (TOD).
Recommendation 124:
LMG, KIPDA, developers and the public should promote and invest in transit-oriented development as a way of planning for more livable, sustainable communities through the
integration of transit and development at the regional, community, corridor and neighborhood levels.
4.3 Transportation Greenhouse Gas Emissions
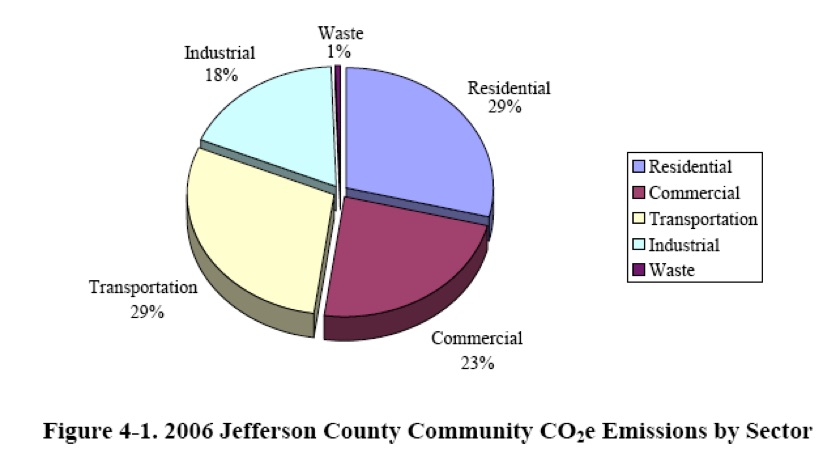
In 2006, Louisville Metro GHG emissions from transportation accounted for 29.2% of inventoried GHG emissions. Sources in this sector, which includes onroad and nonroad (e.g., construction equipment, lawn care, agricultural, rail) vehicles in Jefferson County, released 5.6 million tons of CO2e emissions.
Since the transportation sector accounted for such a large portion of the local GHG emissions, it warrants investigation as to how to reduce these emissions. A significant portion of these transportation related emissions results from to single occupancy vehicles.
Nationally, according to EPA inventory data for 2003, the transportation sector is the source of 29% of U.S. GHG emissions. This sector is the fastest-growing source of U.S. GHGs, accounting for 47% of the net increase in total U.S. emissions since 1990. Transportation is also the largest end-use source of CO2, which is the most prevalent greenhouse gas.24 Production of CO2 is related to the amount of fuel
combusted and its carbon content. The emission rate of CO2 cannot be affected by vehicle emissions control technologies. Methane and nitrous oxide (N2O), also significant GHGs, can be affected; however, they only account for a small percent of the transportation sector’s GHG total (2% nationally in 2003).
Much of the development that has occurred in the greater Louisville region over the last 50 years has been predicated on automobile ownership. As a result, the percentage of people who travel by car for work during 2007 was 96.3%.26Also, total trips by TARC in 2009 were estimated to be only 2.4% of all vehicle trips in the county.27 According to KIPDA, since 1980, the amount of driving done by Kentuckians rose at a rate 4.6 times the rate of population growth, though nationally the rate is three times faster than population.
The recommendations that follow attempt to address locally the goals expressed in the U.S. Mayors’ Climate Protection Agreement, especially the primary goal of reducing GHG emissions 7% below 1990 levels by 2012. This Report presents analysis and strategies to help the Louisville Metro area meet thisGHG reduction goal as well as acting as a guide for improving Louisville Metro’s quality of place. The more livable a metro area is, the more population retention it experiences and the more prosperous it becomes by attracting and retaining vital industry and business interests. Many strategies intended to reduce transportation sector emissions depend more on policies and programs shaped at the national,
state and regional level than the local level; nevertheless, as the “Greater Louisville Project, 2005 Competitive City” has clearly stated: “NOW is the time to forge a broad community consensus to formulate a comprehensive mobility strategy.
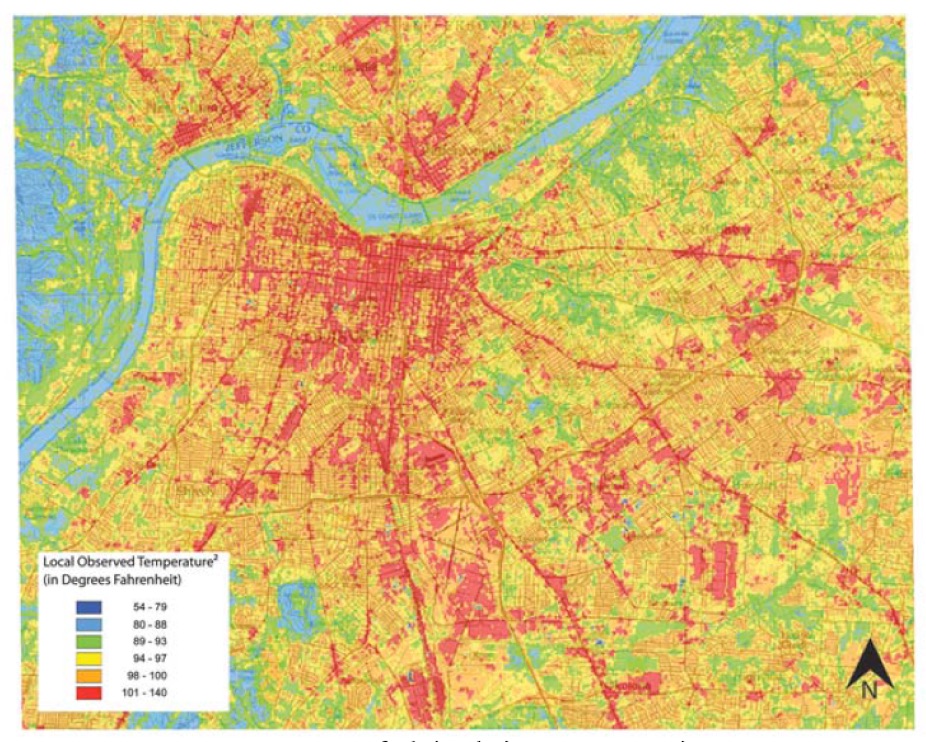
This amazing summer time infra-red photo of Louisville is reprinted from the Partnership for a Green City Climate Action Report April 22, 2009. The angry red areas are higher temperature caused by black asphalt streets and rooftops and vast concrete areas baking in the sun. This photo shows the lower income residents of the west end suffer higher temperatures from the heat island effect --in contrast to the east end with greater greenspace and large parks.
credit to Chris Choi, USEPA Region 5
“We begin with a brief primer on greenhouse gases. As their
name suggests, when released into the atmosphere, these gases act “like the ceiling of a greenhouse, trapping solar energy and retarding the escape of reflected heat.” Massachusetts v. EPA, 549 U.S. at 505. A wide variety of modern human activities result in greenhouse gas emissions; cars, power plants, and industrial sites all release significant amounts of these heat trapping gases. In recent decades “[a] well-documented rise in global temperatures has coincided with a significant increase in the concentration of [greenhouse gases] in the atmosphere.” Id. at 504-05. Many scientists believe that mankind’s greenhouse gas emissions are driving this climate change. These scientists predict that global climate change will cause a host of deleterious consequences, including drought, increasingly severe weather events, and rising sea levels.
The Supreme Court held in Massachusetts v. EPA that greenhouse gases “unambiguous[ly]” may be regulated as an “air pollutant” under the Clean Air Act (“CAA”). Id. at 529. Squarely rejecting the contention—then advanced by EPA—that “greenhouse gases cannot be ‘air pollutants’ within the meaning of the Act,” id. at 513, the Court held that the CAA’s definition of “air pollutant” “embraces all airborne compounds of whatever stripe.” Id. at 529 (emphasis added). Moreover, because the CAA requires EPA to establish motor-vehicle emission standards for “any air pollutant . . . which may reasonably be anticipated to endanger public health or welfare,” 42 U.S.C. § 7521(a)(1) (emphasis added), the Court held that EPA had a “statutory obligation” to regulate harmful greenhouse gases. Id. at 534.”
Environ. Sci. Technol. 2012, 46, 6455−6469 June 2012 issue
Review of Methane Mitigation Technologies with Application to Rapid Release of Methane from the Arctic
Joshuah K. Stolaroff,* Subarna Bhattacharyya, Clara A. Smith, William L. Bourcier, Philip J. Cameron-Smith, and Roger D. Aines
“If the beginnings of a rapid methane release are detected, it would very likely be desirable to stage a large-scale technological intervention to contain Arctic methane and
avoid triggering the feedback loop.”
“Over a 20-year time scale, which is relevant to the near-term threat of crossing a climate tipping point, methane is 72 times more potent [than CO2].”
“Our climate is changing. Historical climate data will not be sufficient in predicting future storm events. 100-year storms are occurring with increasing frequency. The number of storm events occurring with greater intensity is also increasing. Designs based on historical 100-year storms may not be sufficient in the future.”
EPA - Heinz J. Meuller NEPA Office - Comments to the revised Rule of Decision in the Louisville Bridges Project See it HERE
