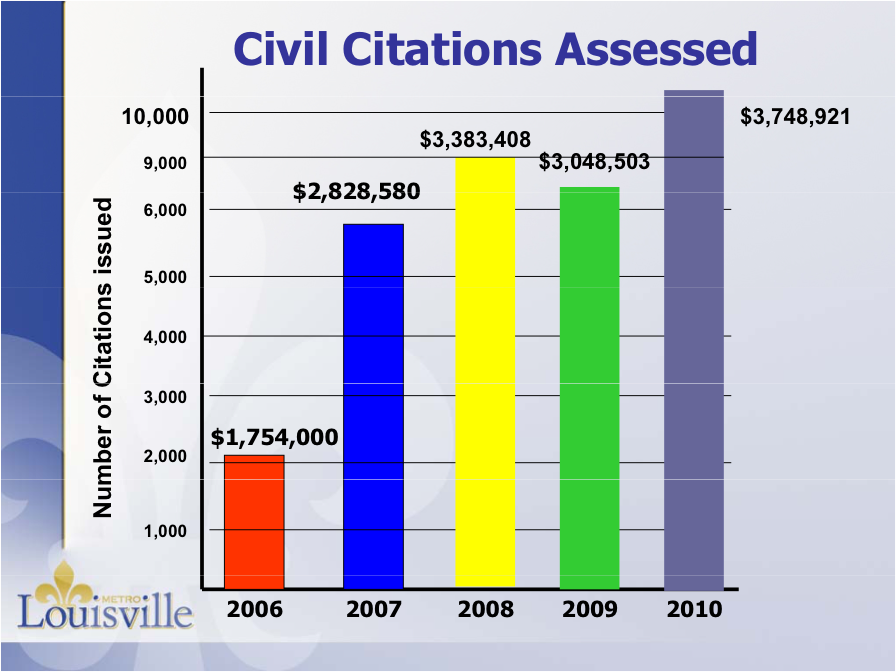
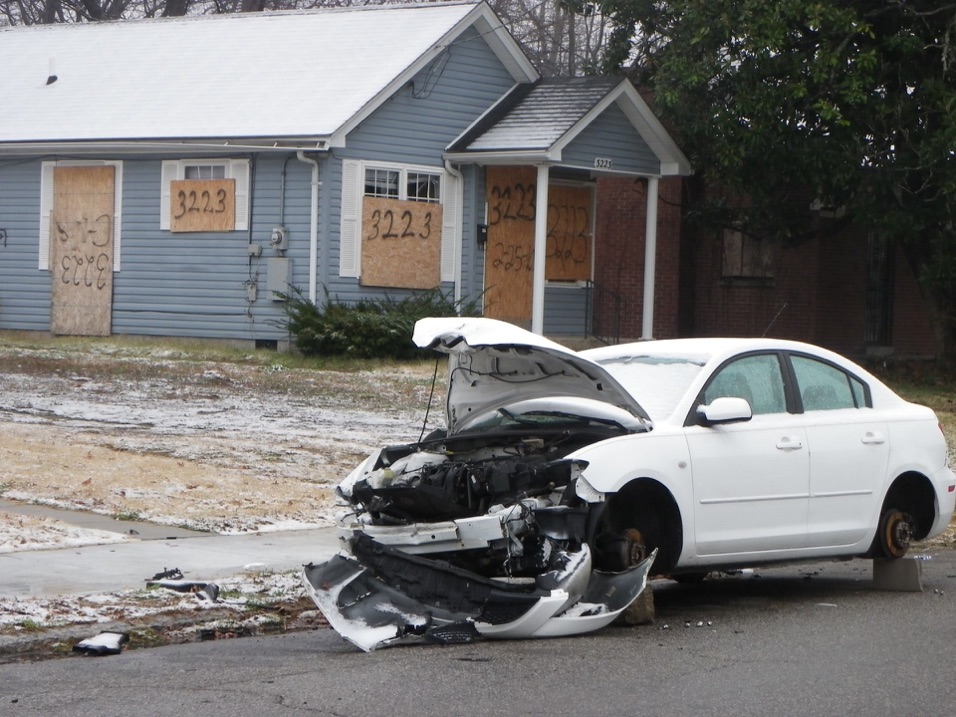
Poor and struggling property owners have been socked with $ 14,763,412 million in property maintenance code violations under laws adopted during the Democratic administration of Jerry Abramson. Despite the collapse of the Title VI economy and widespread foreclosures on the same low income property owners, the current intent of city government is to ramp up enforcement and take more property. 


A new policy document calls for:


CONSISTENT, STEADY AND ACTIONABLE PROGRESS


Summit Recommendations


I. Stricter enforcement by IPL Department


a. Shorten the wait for demolition


b. Quicker turnaround on IPL inspections when complaints come in


c. Increase fines


d. Grant limited-time amnesty to encourage payment


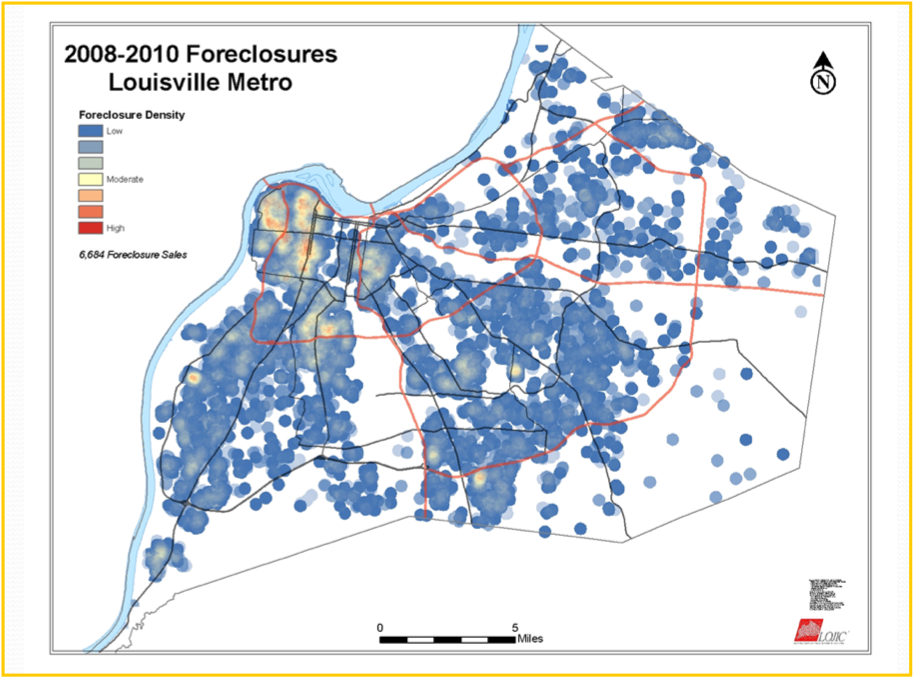
II. Tactical/strategic foreclosures in particular areas


III. Strict adherence to violations/penalties at Code Board level


IV. Mass foreclosures


V. Continued pursuit of state escheatments


VI. Prioritize neighborhoods on verge of becoming unstable


VII. Revive Blight Busters


  1. VIII.Create Neighborhood Property Watch


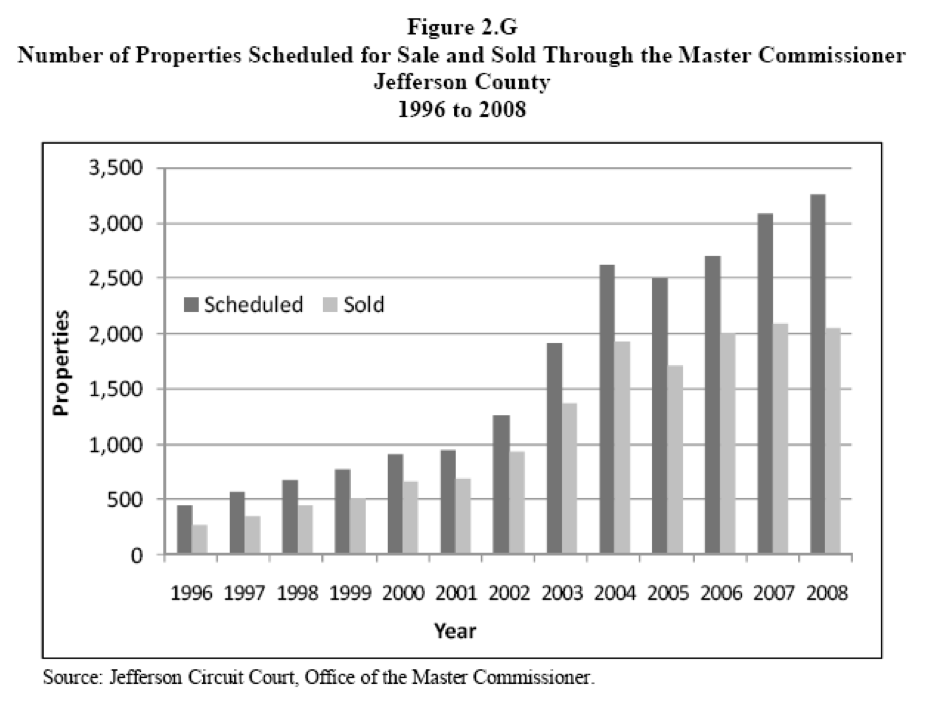
Graph below from:  LRC: Housing Foreclosures in Kentucky

Aggressive enforcement of Metro property maintenance codes, contributes to foreclosures among the poor and black in the west end.  

According to new 2010 Census data cited in Greater Louisville Project - 2011 Competitive City Report, almost 27,000 more Jefferson County residents are living in poverty today, than in 2000 at time of the last census.


Rates of Vacant , abandoned and Underutilized property are skyrocketing, especially in the West End in the majority African American community west of 9th street.

This area is recognized as a Title Vi area of low income minority people in the KIPDA Regional Transportation Plan, Horizon 2030

The PVA and IPL agencies of Metro Government have recognized these trends-


In April, 2011, the Louisville Metro Property Valuation Administration staff,  and Inspections Permits and Licenses staff,  jointly with other concerned organizations and groups presented relevant data -- Louisville Vacant, Abandoned and Underutilized Property Summit  - Problems and Challenges 


The data showed evidence of an economic collapse in the same Title VI area of Metro Louisville including:  


•  6,684 home foreclosures from 2008-2010.

•  vacant structures with IPL citations and large fines, 4,640 as of April 2011, and

•  1,174 Abandoned urban properties as of April 2011.

The PVA noted that the area suffered from “Lack of employment and retail in hardest hit areas,” and  called upon all government agencies to engage in “a comprehensive plan for redevelopment.”   A necessary principal focus was identified --, “Employment, retail, and transportation issues (possible development of a business park or intermodal cargo distribution center).” 


See more maps and data  HERE

Unfortunately, Metro Council toughened the property maintenance code in 2007 and Inspections Permits and Licenses, IPL began a campaign to enlist neighbors and neighborhood associations to report violations so homeowners could be cited or criminally charged and arrested for failure to maintain premises. The citations and fines were released in a startling graph:

Metro Ordinance - Property Maintenance Code


§ 156.999 PENALTY.

Any person, firm or corporation who shall violate§ 156.057(A)(2) shall be subject to a civil penalty in accordance with the penalty schedule as set forth in Appendix A, Exhibit A. Any person cited pursuant to this subsection may pay the minimum civil penalty within seven days from the date of issuance or request a hearing such penalty to the Code Enforcement Board ("Board") in accordance with§§ 32.275 et seq. If the person fails to respond to the citation within seven days as referenced above, the person shall be deemed to have waived the right to a hearing.


§ 156.998 VIOLATIONS; REMEDIES.


A.

1.The Metro Government shall possess a lien for all fines assessed for the violation of this chapter and for all charges and fees incurred by the Metro Government in connection with the enforcement of this chapter in accordance with §32.288 .

2.In addition to the remedy prescribed in subsection (D)(1), above, the person found to have committed the violation of this chapter shall be personally responsible for the amount of all fines assessed for the violation and for all charges and fees incurred by Metro Government in connection with the enforcement of this chapter. Metro Government may bring a civil action against the person and shall have the same remedies as provided for the recovery of a debt in accordance with§ 32.288 .


1.Any person, firm or corporation violating any of the provisions of § 156.203, or neglecting to comply with any order issued pursuant to § 156.203, shall be guilty of a misdemeanor and shall be fined not less than $25 nor more than $1,000, or be imprisoned for not more than 60 days, or both. Each day's violation shall constitute a separate offense

2.Any person, firm or corporation, who shall violate any provision of§ 156.203 shall be subject to a civil penalty of not less than $100 nor more than $1,000. Each day that a violation continues after a citation has been issued or notice has been served shall be deemed a separate offense.


Metro Government Policies leading to separate and unequal outcomes.


Several factors caused the current economic collapse in the west end. 


  1. Horizon 2030, the KIPDA Regional Transportation Plan has denied adequate transportation infrastructure planning for the low income Title VI area.  KIPDA has a duty to plan sufficient transportation projects in historic ghetto’s created by racism and segregation policies. The collapse of the west end economy is caused in part by the inability of poor people to find affordable transportation routes to jobs located in industrial parks in the south and east county. Billions of dollars of transportation infrastructure are being spent in Louisville Metro, but only a few million inside the Title VI area to enhance low income mobility.


•   Nationally the real estate housing bubble burst causing home values to slide. The downard trend in the economy, rising unemployment in the private sector, and reductions in public job programs impacted low income people and those who had engaged in housing speculation in the west end using predatory, sub prime loans.  


• The city focus on spending $ 758 million in public funded projects Downtown including $ 458 million on the Yum stadium neglected human needs in the Title VI area. The poor would be given fountains to play in and concerts on the Waterfront to distract them from the lack of transportation and economic development projects in the Title VI area.


  1. In 2007,  Metro Council including the liberal Democrats, approved changes to the property maintenance code and IPL began more stringent enforcement.  Metro Council made no study of the likely disparate impact on the Title VI area that would result from changing the code to increase enforcement,  fines and criminal penalties for neglected properties.

  Metro Council passes laws without a requirement for analysis of disparate impact to the Title VI area.


  1. Compliant neighborhood representatives began to cooperate by turning in the house address of local properties that were in violation of the housing code, and harsh civil fines and even criminal prosecution followed. The property owners already impacted due to declining employment and loss of renters, could not pay mortgages under predatory loans, and were prosecuted for property code violations. Thousands of properties were sold in foreclosure.


Property maintenance codes are adopted to support municipal interests in public health and safety. However, the codes have a great potential to be enforced disparately against low income and minority homeowners due to their precarious income circumstances. This is a typical public health justification for municipal action:


“Relying on common law tradition and the statutory grant of general police power, modern cities have a variety of powerful tools available to combat the negative impact foreclosures on individual homes and neighborhoods. When foreclosed homes become vacant due to abandonment or eviction they often quickly succumb to the forces of nature and the elements; grass and weeds grow long, swimming pools become stagnant public health hazards, landscaping dies from lack of attention or grows out of control, windows break, and exteriors suffer damage from normal wear-and-tear and vandalism. The domino effect of one distressed home having a negative impact first on neighboring residences and then on entire neighborhoods is familiar to city officials. When this occurs, municipalities must aggressively enforce local codes.”


Local Research on Causes


In a recent paper, available on the web,  <http://www.rc21.org/conferences/amsterdam2011/index.php>

Why are Foreclosures Highest in African American Neighborhoods?

A Case Study of a Middle Size City,   by John I. Gilderbloom, professor of Urban and Public Affairs at the University of Louisville, he reports on the Louisville foreclosure crisis:


“While previous findings indicate that a key explanatory variable positively affecting neighborhood foreclosures is the proportion of minorities, our analysis finds that the effect of percent non-white is impacted by several key intervening variables, including absence of neighborhood walkability, presence of investor foreclosures, and prevalence of high cost loans. In the past, walkability and investor behavior have largely been ignored by social scientists studying neighborhood variation in foreclosures.”


Walkability or “Walk score” is defined in the appendix as:


“Walk Score is a measure of the proximity or a range of typical goods, services and activities to a particular household. As a result, locations with high Walk Scores are not only more conducive to walking, they are also similarly more conducive to cycling and are more likely to be more well served by transit. In addition, because a wide range of activities are available close at hand, locations with high Walk Scores enable households to drive shorter distances when they do choose to travel by car.”


The walkability variable was developed by walkscore.com by using the geographic centroid from each census tract, then pulling the closest real world address to that centroid. We then used this as a proxy for the remaining area to get an approximation of the walk score for each tract (Author, 2010). Measuring walkability by using WalkScore.com has already been accepted in several scholarly papers as a reasonable measure of walkability. . The walkable score ratings seem to be a good approximation of Louisville neighborhoods that are both walkable and non-walkable. Scores that are generally lower than 50 are car dependent locations where there are not a lot of amenities that a person can walk to.” 


In Table 1, Descriptive Statistics, Guilderbloom determined a mean, walkability index of 42.69 for his study area.


By finding the high foreclosure neighborhoods have low walk scores, Guilderbloom implicitly finds deficient regional transportation planning in the Title VI area, though he does not make a detailed examination of low employment and transportation issues in the high foreclosure zone in the article.


The paper includes interesting data:

“The Center for Responsible Lending (CRL) estimated that approximately 6.6 million families nationally have lost their homes between January 2007 and August 2010, causing a net loss of $502 billion in property values since the start of the crisis. The CRL also estimates that up to 12 million homes could be foreclosed upon within the next five years, which would undoubtedly prolong a full economic recovery (Center for Responsible Lending, 2010).”


Locally, Gilderbloom finds that the majority of investor foreclosures occurred in the low income black neighborhoods of west Louisville. He introduces a variable “walkability” as impacting on foreclosures:


“Thus far no studies have linked walkability  and foreclosures. We predict that the more walkable a neighborhood, the greater the house values. In addition, neighborhood walkability may be correlated with foreclosures because of recent shifts in the housing and energy markets. Given drastic increases in fuel costs, and thus commuting costs, walkable neighborhoods are more desirable and, as a result, less impacted by the bursting bubble. Non-walkable neighborhoods—lacking employment opportunities and amenities within walkable distances—are expected to experience greater numbers of foreclosures.”

[my emphasis added] 


“When we isolate just investor foreclosures, the predictive power of percent nonwhite (see betas) nearly doubles from the previous equation measuring all foreclosures. In this case, it surpasses high interest loans as the most important predictor. Clearly, these poorly-performing investors targeted black neighborhoods. As was noted in Davis (2009), most speculators were white, lived in mostly all white neighborhoods and lived around five to ten miles away.”


Gilderbloom cites to a Courier-Journal story for support that white, speculators targeted the black west end neighborhoods and then suffered financial reversal when poor walkability and other factors lowered property values and led to trouble with their sub prime loans.   (Davis, Alex (2009) Investor Foreclosures Mount. March 3, 2009 Courier-Journal).


“Amid the recent economic recession, foreclosures catapulted to national attention in early 2007 when the collapse of the national housing price bubble left many borrowers “underwater,” or living in a home worth less than the amount owed on the mortgage. The situation was exacerbated when many affected homeowners encountered difficulty refinancing their adjustable rate mortgages (ARMs) that were about to reset to higher interest rates. For many, foreclosure became the only option.”


In the universe of variables examined by Guilderbloom he finds:


“[First] . . .Our research shows that different social, political and economic forces provide distinct explanations of why and how foreclosures occur in different neighborhoods. Second, race is correlated with high investor foreclosures but these foreclosures are most likely caused by investors (mostly white) exploiting black neighborhoods. Third , we show that walkable neighborhoods have fewer homeowner foreclosures, although the relationship is weak compared to other variables like high interest rate loans. Finally, we show that the concentration of high cost loans in a neighborhood is strongly correlated with neighborhood foreclosures—an expected finding that confirms other research.”


While some of this seems well argued, the reliance on a Courier-Journal article to determine “most” investors were white seems off, and curiously, though IPL criminal charges for violation of property maintenance codes follow state requirements for collecting race data in criminal charges, the race data was not presented anywhere other than by inferring from the map point clusters. Since actual race data has been correlated to foreclosures and civil and criminal cases on property maintenance code violations--lets get it out where people can see whether it supports the claim that many investor foreclosures involve white speculators.


Otherwise, Gilderbloom’s article confirms that neglect by the Metro government and KIPDA  contribute to foreclosures:


“Our maps show that that where you have a high concentration of blacks you also have a higher share of investor owned properties and low walk-ability scores---these two variables help explain the high number of foreclosures in black neighborhoods (see Figures 3 and 4) . . . we need to rethink the conventional wisdom of an association between neighborhood racial composition and foreclosure rates. Policymakers must recognize that a key cause of this crisis is investors who do not live in the neighborhood and are not culturally or financially astute about certain neighborhood housing markets. ” 


The correlated race data, if and when it is released, may not give the same weight to the “white investor foreclosure” theory.


Appendix data:

Why are Foreclosures Highest in African American Neighborhoods?

A Case Study of a Middle Size City,   by John I. Gilderbloom


Table 1: Descriptive Statistics


Specification                                                                 Mean                         Std. Deviation                         N

Foreclosure sales from 07-08                                     23.580                             19.400                               170

Investor foreclosure sales from 07-08                         4.420                                 7.963                               170

Owner-occupied foreclosure sales from 07-08         19.165                               14.881                                170

Distance to the central business district (CBD)

tract (49) in miles                                                            7.036                               4.031                              170

Total jobs per square mile, 2000                              1882.604                         4023.136                               170

Percent of nonwhite residents, 2000 (ratio*100)          25.354                          28.513                                  170   

Percent of vacant units, 2000 (ratio*100)                     6.443                             4.026                                   170

Median housing age, 2000                                         38.730                             15.059                                 170

Total crimes per 100,000 residents, 2004,

by LMPD district                                                            6.109                             3.221                                   170

High interest loans-foreclosure count                             9.920                           7.286                                    170

Median household income, 1999 (2000 Census)     40524.450                     19527.820                                170

Median assessed value (MAV), 2000, in dollars         88594.260                 49071.475                                 170

Walkability index                                                          42.69                               23.604                                170


Maps from the  Louisville Vacant, Abandoned and Underutilized Property Summit  - Problems and Challenges  presentation by the PVA and IPL in Metro Louisville

       INDEX       I        TRANSPORTATION       I        SOCIAL JUSTICE        I        ENVIRONMENT    I       CREEKS         I        PHOTO ESSAYS        I    BOOKS & ARTICLES

Is Louisville, KY worse than Ferguson, MO or much worse? 


Calling on Metro to match the Justice Department and clearly present the ‘revenue policing’ data


(c) 2015   Bud Hixson

On March 4, Attorney General Eric Holder released two Justice Department Reports-one on the Michael Brown killing and the other on racial disparity in policing in Ferguson Missouri:


“The Civil Rights Division of the United States Department of Justice opened its investigation of the Ferguson Police Department (“FPD”) on September 4, 2014. This investigation was initiated under the pattern-or-practice provision of the Violent Crime Control and Law Enforcement Act of 1994, 42 U.S.C. § 14141, the Omnibus Crime Control and Safe Streets Act of 1968, 42 U.S.C. § 3789d (“Safe Streets Act”), and Title VI of the Civil Rights Act of 1964, 42 U.S.C. § 2000d (“Title VI”). This investigation has revealed a pattern or practice of unlawful conduct within the Ferguson Police Department that violates the First, Fourth, and Fourteenth Amendments to the United States Constitution, and federal statutory law.”


Ferguson’s law enforcement practices are shaped by the City’s focus on revenue rather than by public safety needs. This emphasis on revenue has compromised the institutional character of Ferguson’s police department, contributing to a pattern of unconstitutional policing, and has also shaped its municipal court, leading to procedures that raise due process concerns and inflict unnecessary harm on members of the Ferguson community. Further, Ferguson’s police and municipal court practices both reflect and exacerbate existing racial bias, including racial stereotypes. Ferguson’s own data establish clear racial disparities that adversely impact African Americans. The evidence shows that discriminatory intent is part of the reason for these disparities. Over time, Ferguson’s police and municipal court practices have sown deep mistrust between parts of the community and the police department, undermining law enforcement legitimacy among African Americans in particular. “


The Attorney General in releasing the report made clear that the Justice Department finds that this pattern and practice was not confined to the Ferguson Police and Municipal Courts system alone, but can be found in many cities across the U.S.


Revenue enhancement policing with citation quotas shows a pattern and practice  of  institutional racism.


Because of our history of discrimination and our highly race segregated community, Louisville Metro and the Courts should release in clear graphic form -the same citation revenue data for this community that the Justice Department produced for Ferguson--are we better, worse or much worse?

Unlike Ferguson, the Louisville police department covers a large metropolitan county of more than 756,832 residents of which some 20.8 % are ‘black’ and 70.5 % are white. (2010 Census) African Americans made up 67 % of Ferguson’s population of  21,203. But the police department had 50 white officers and only 5 black. The Justice Department Reports (available for download) document the finding of intentional racism. Blacks were targeted for ‘revenue policing’ where officers competed to pack the most number of violations into a stop and arrest and were exhorted by the city managers to meet city budget targets for revenue produced by fines, penalties and court costs.


Louisville ranked as the 43rd most segregated of 102 metropolitan areas according to an analysis of 2010 Census data (compared to 41st in 2000 and 31st in 1990). 45 percent of Louisville residents live in extremely racially segregated areas. (MHC “State of Fair Housing”). There is every reason to believe revenue policing is a disparate practice here.

Though African American males make up just 22% of the total Louisville male population, they make up 53.6 % of the population of males in the Main Jail complex this month, according to statistics published on its webpage by Metro Corrections. That gap 22% to 53.6% or about 31.4 percentage points is greater than the gap between 67% of the Ferguson population and 93% total arrests which is only 26 percentage points. If the Justice Department is alarmed and taking federal action about 26% disparity--when will they focus on Louisville’s 31 % arrest disparity? These numbers indicate an increase in race disparate arrests from 2013 of 10%.

Louisville’s racial disparity in arrests as demonstrated by corrections statistics demands an answer from Metro government--what is the revenue generated from disparate arrest and prosecution? Is ‘revenue policing’ increasing poverty and homelessness? Are we better, worse or much worse in punishing poor people, than Ferguson?

See CRIME page


             HERE

CURRENT


596/1,111=    53.6%


483/1,111=     43.4 %

CURRENT


154/367=     41.96%


204/367=     55.5 %

Pattern and practice

2013-2014 Vehicle Stops Data Analysis

Annual Report (April 2013 through March 2014)

The LMPD Traffic Stop Study showed that a total of 87,775 vehicle stops were made by LMPD. 24,577 black drivers (28%) and 58,897 white drivers. 

in the one year period, a total of 7,843 stops resulted in searches. 42% of that total were searches of black drivers (3,367) versus being only 20.5 % of the total population in Metro.

3.1 % of the whites were arrested (1,825) but

5.4 % of the blacks were arrested (1,327) So blacks made up 42% of arrests from all traffic stops versus being 20.8 % of the population.


Revenue policing and prosecution

In the Justice Department’s Report, it describes how the city manager of Ferguson exhorted the police department to increase revenues from citations by 10 %. This was not anything related to improving public safety, but was a predatory revenue grab that increased stops and arrests.


Municipal Court practices in Ferguson were cited by the AG for producing disparity:


“Most strikingly, the court issues municipal arrest warrants not on the basis of public safety needs, but rather as a routine response to missed court appearances and required fine payments. In 2013 alone, the court issued over 9,000 warrants on cases stemming in large part from minor violations such as parking infractions, traffic tickets, or housing code violations. Jail time would be considered far too harsh a penalty for the great majority of these code violations, yet Ferguson’s municipal court routinely issues warrants for people to be arrested and incarcerated for failing to timely pay related fines and fees. Under state law, a failure to appear in municipal court on a traffic charge involving a moving violation also results in a license suspension. Ferguson has made this penalty even more onerous by only allowing the suspension to be lifted after payment of an owed fine is made in full.”

“Together, these court practices exacerbate the harm of Ferguson’s unconstitutional police practices. They impose a particular hardship upon Ferguson’s most vulnerable residents, especially upon those living in or near poverty. Minor offenses can generate crippling debts, result in jail time because of an inability to pay, and result in the loss of a driver’s license, employment, or housing.”


The Justice Department gave a thorough review of the symbiotic relationship between --race disparate arrests and prosecutions for minor violations-- and the revenue stream generated in the courts. When all three branches of local government are linked in a “pattern or practice’ that denies the constitutional rights of minorities-- its structural racism. Louisville should release the race disparate revenue collections data showing the dollars collected from disparate arrests and prosecution.

SILENT CRISIS

LOUISVILLE WEST END


2007-2011

BadwaterJournal.com

WHAT UNSUSTAINABLE URBAN GROWTH LOOKS LIKE

Published online at Louisville, Kentucky USA -

An independent, secular, contemporary journal of political and environmental issues dedicated to peaceful reduction of human impacts on Earth

WAR ON POOR webpage

updated 3-26-15


Front page  HERE