
Comparing air pollution sources in
Metro Louisville
There is a notice of a hearing on the Kentucky Division of Air Quality state website:
Dec. 22, 2011
The Kentucky Division for Air Quality will conduct a public hearing on Feb 3, 2012 at 10 a.m. (EST) in the conference room of the Louisville Metro Air Pollution Control District, 850 Barret Ave., Louisville, Ky. This hearing is being held to receive comments on a proposed State Implementation Plan (SIP) revision to redesignate the Kentucky portion of the Louisville, Kentucky-Indiana area from nonattainment to attainment for the annual PM2.5 National Ambient Air Quality Standard to address sections 107 and 175A of the Clean Air Act (CAA). If no request for a public hearing is received, the hearing will be cancelled and notice of the cancellation will be posted on this website. Further information can be obtained by calling Leslie Eggen at the number below or email at lesliem.eggen@ky.gov
Louisville PM2.5 Redesignation Submittal to U.S. EPA
at
http://air.ky.gov/Pages/PublicNoticesandHearings.aspx
The state is asking EPA to remove the Louisville Metro area from non-attainment status for violations of annual particulate matter standards.
“As a result of the 2005 PM2.5 designations, U.S. EPA designated the Louisville, KY-IN area nonattainment for the 15.0 μg/m3 annual standard.”
As part of its application to have Louisville removed from non-attainment status for particulate matter, the KYDAQ had to furnish testing and modeling results estimating the contribution of various sources of air pollution in Louisville.
What is Fine Particulate Matter (PM2.5)?
“Particulate matter (PM) is the term for particles and liquid droplets suspended in the air. Motor vehicles (i.e., cars, trucks, and buses) emit direct PM from their tailpipes, as well as from normal brake and tire wear. Vehicles cause dust from paved and unpaved roads to be re-entrained, or resuspended, in the atmosphere. Construction of highway and transit projects may cause dust. Finally, gases in vehicle exhaust may react in the atmosphere to form particulate matter.
Particles come in a wide variety of sizes and have been historically assessed based on size, typically measured by the diameter of the particle in micrometers. PM2.5 or fine particulate matter refers to particles that are 2.5 micrometers or less in diameter. In comparison, a human hair is about 70 micrometers in diameter and a grain of sand is about 90 micrometers in diameter.
The National Ambient Air Quality Standards for fine particulate matter include an annual standard of 15.0 micrograms per cubic meter (ug/m3) and a 24-hour standard of 65 ug/m3. The annual standard is based on a 3-year average of annual mean PM2.5 concentrations; the 24-hour
standard is based on a 3-year average of the 98th percentile of 24-hour concentrations.”
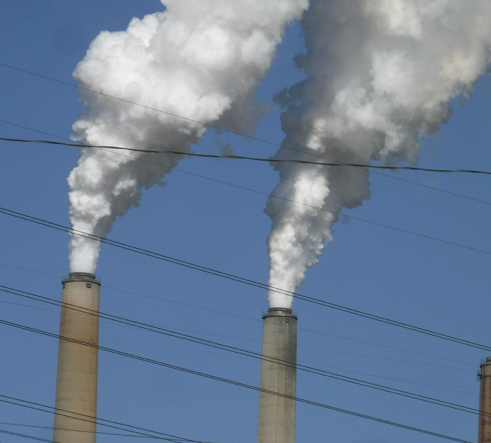
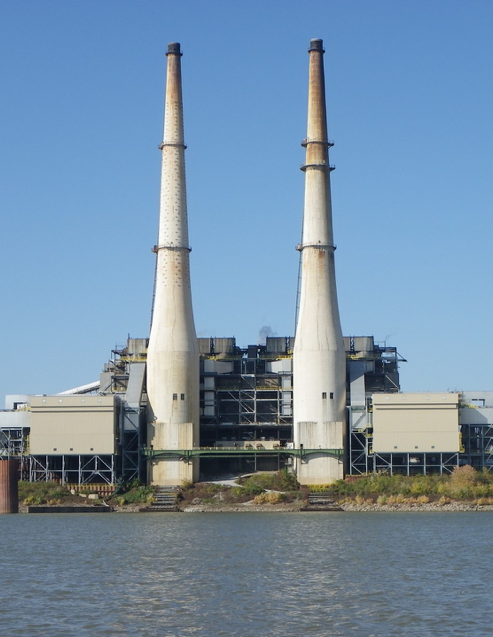
The data submitted establishes that coal fired electric utility plants are the largest emissions sources of particulate matter, nitrogen oxide ozone precursor compounds and sulfur oxide compounds.
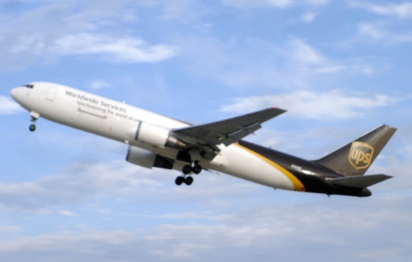
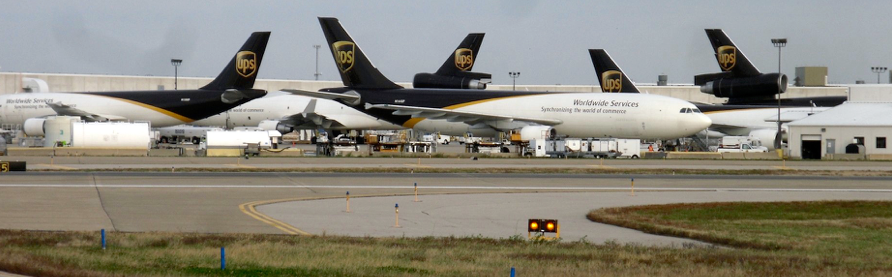
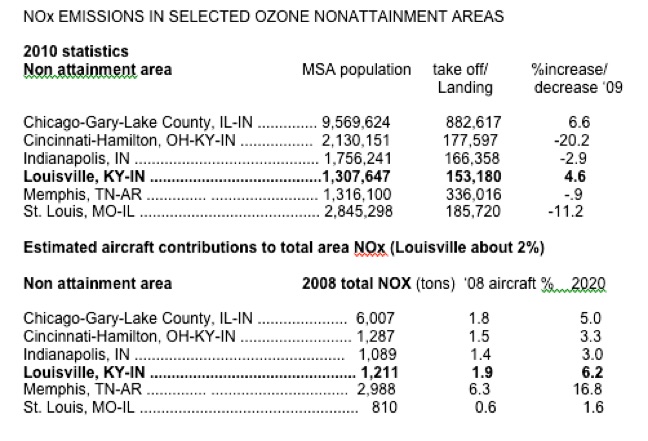
AIRPORT NOx POLLUTION
Buried statistically in the total tonnage of NOx and PM 2.5 across the Metro area the contribution of airport take off and landing jet emissions is calculated at only 2% of the total. This does not accurately depict the fact that in the immediate vicinity of the airport, concentrations may be much higher in a local hot spot of particulate and ground level ozone pollution.
Data from these charts can be found:
http://aci-na.org/content/airport-traffic-reports
http://www.cvgairport.com/about/news/stats.html
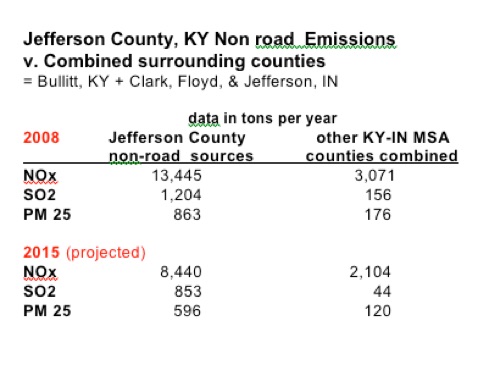
Non road sources
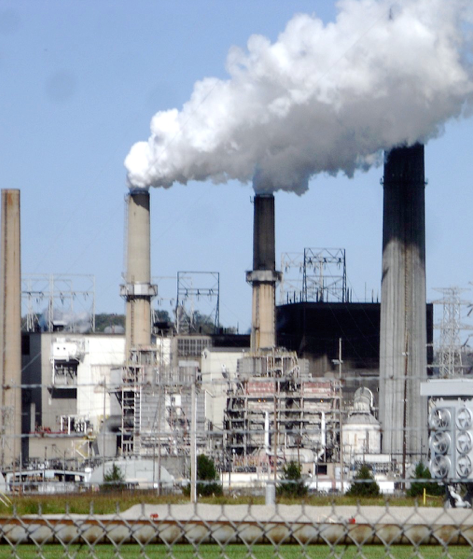
EGU - electric generating units
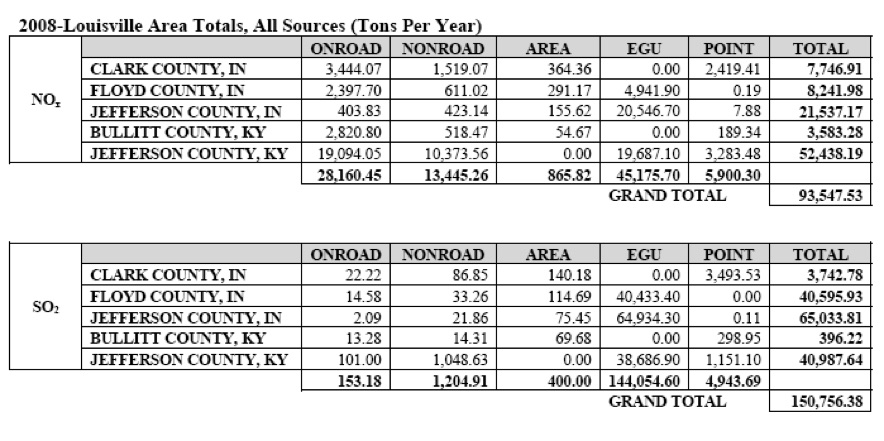
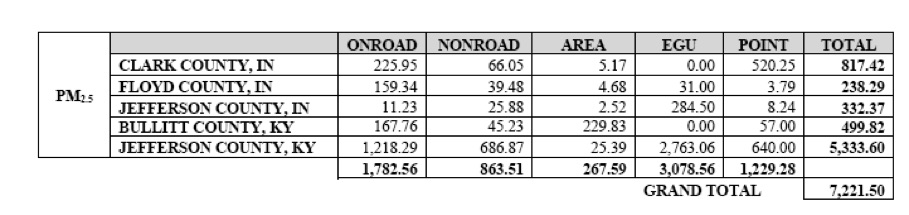
EGU or Electric Generating Unit emissions--power plants--dwarf all other emission sources of the three pollutant categories in the area.
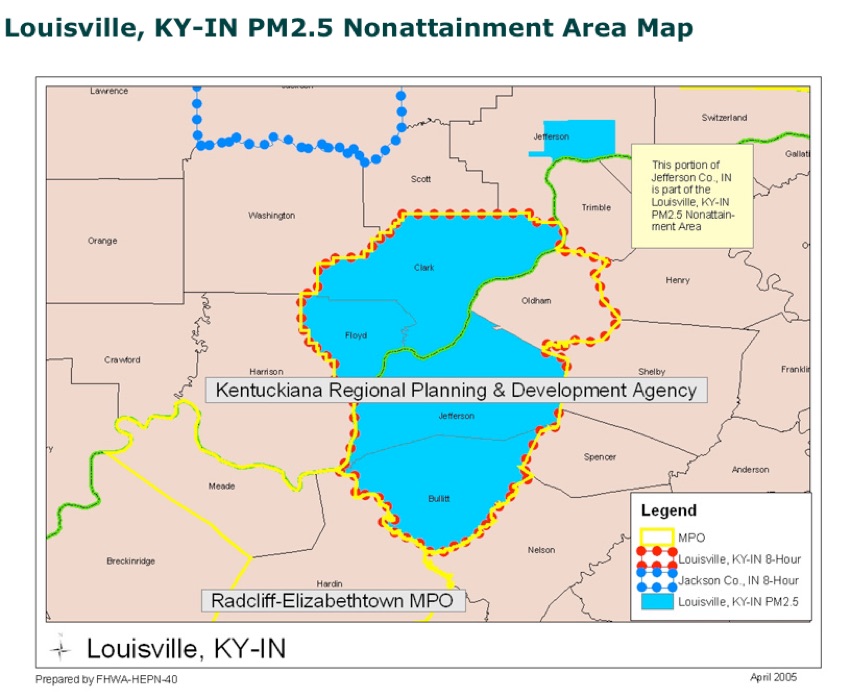
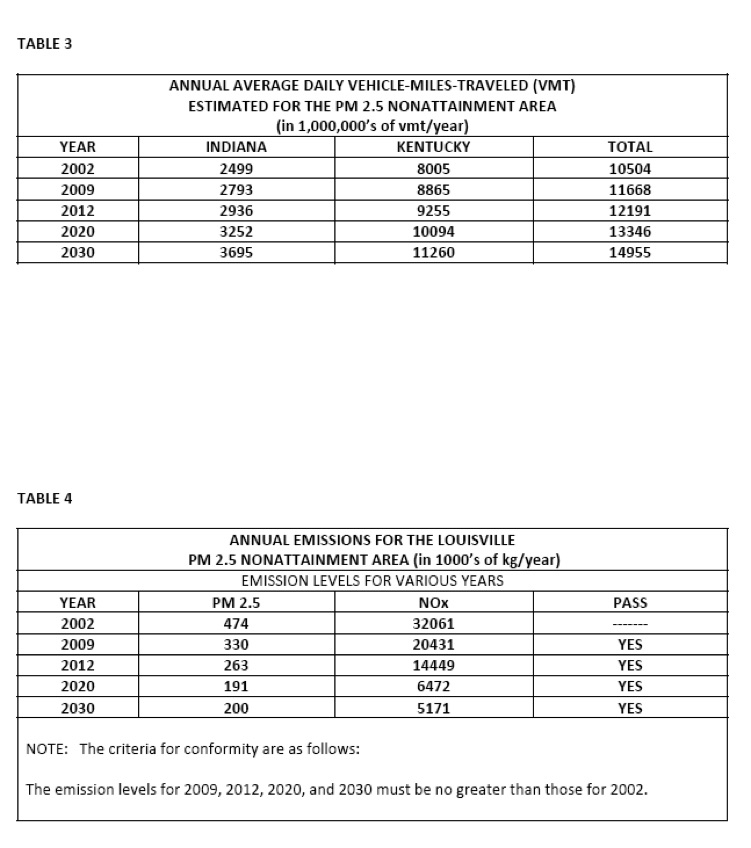
As shown on the Tables below pulled from the KYDAQ application and KIPDA documents, the non-attainment airshed includes Jefferson and Bullitt counties in Kentucky, and Clark, Floyd and Jefferson counties in Indiana.
Other PM 2.5 Issues
The conformity rule requires that direct vehicle PM 2.5 from the tailpipe and brake and tire wear be analyzed. The rule also requires that oxides of Nitrogen (NOx) (one of the PM 2.5 precursors) must be analyzed unless EPA and the respective state air agency make findings that its influence is insignificant.
PM 2.5 from road dust and the other precursors (volatile organic compounds, oxides of Sulfur, and ammonia) do not have to be considered because neither EPA nor the respective state air agency has made a finding of significance for them.
PM 2.5 from construction dust does not have to be considered because there is no State Implementation Plan (SIP) indicating its influence is significant. http://www.cvgairport.com/about/news/stats.html
Welcome to BadwaterJournal.com©
Basis of KYDAQ projected decrease in emissions
Page 34
“As shown in Table 34, PM2.5 emissions in the nonattainment area are projected to decrease by
985.05 tpy in 2015 and 495.74 tpy in 2025.
NOx emissions in the nonattainment area are projected to decrease by 27,467.08 tpy in 2015 and 37,659.64 tpy in 2025.
SO2 emissions in the nonattainment area are projected to decline by 74,250.88 tpy in 2015 and 73,321.63 in 2025.
Area source emissions and, to a lesser extent, point sources show an increase due to expectations
that the population will grow in this area; however, cleaner vehicles and fuels are expected to be in place in 2009 and 2018, and the CSAPR will be implemented in 2012 and 2014. These programs will cause an overall drop in all three pollutants emissions.
Additional decreases resulted from U.S. EPA rules covering Tier 2 Motor Vehicle Emissions Standards and Gasoline Sulfur Control Requirements, Highway Heavy-Duty Engine Rule, and the Non-Road Diesel Engine Rule.”
Basis of KYDAQ vehicle emissions data projections
Page 16
“ SIP MVEB development was initiated in January, 2010. As of that date, the KIPDA regional travel demand model had been last updated and calibrated during 2005. This update established 2000 as the new base year for the model. The model update utilized the information incorporated into the travel model during previous updates, in particular, information from the 2000 Census and the 2000 KIPDA Household Travel Survey. During the update, the model parameters were adjusted such that the model output matched within reason, three main calibration criteria based on measured data.
These criteria were daily VMT for all highway facilities except local roads for the region;
distribution of trip lengths (duration in time); and highway traffic volumes crossing the Ohio River screen-line. The result of the update was a travel model that replicated travel in the Louisville area for 2000. The subsequent 2011 update and calibration of the TDFM (setting 2007 as a base year) was initiated after work for the PM2.5 redesignation SIP had begun and, therefore, could not be incorporated into the MOVES model runs.”
Louisville Regional Airport Authority Economic Report
In fact, together, Louisville’s airports helped generate 55,608 jobs. That means 9% of total area employment— almost one in every 10 jobs in the Metropolitan Statistical Area—is attributable to airport-related activities. The airports also generate nearly $2 billion in payroll; over $5.6 billion in economic activity; and more than $277 million in state and local tax revenues.*
Perhaps as impressive, the airports reached and exceeded projected growth more than 12 years ahead of schedule and continue to exceed projected growth in the 21st century.
In addition, in 2008, Louisville International Airport handled more than 3.6 million passengers; 158,356 landings and take offs; and 4.3 billion pounds of cargo, making it the 3rd largest cargo airport in North America and 9th in the world.** The volume of goods shipped through Louisville International Airport more than quadrupled from 1986 to 2008.

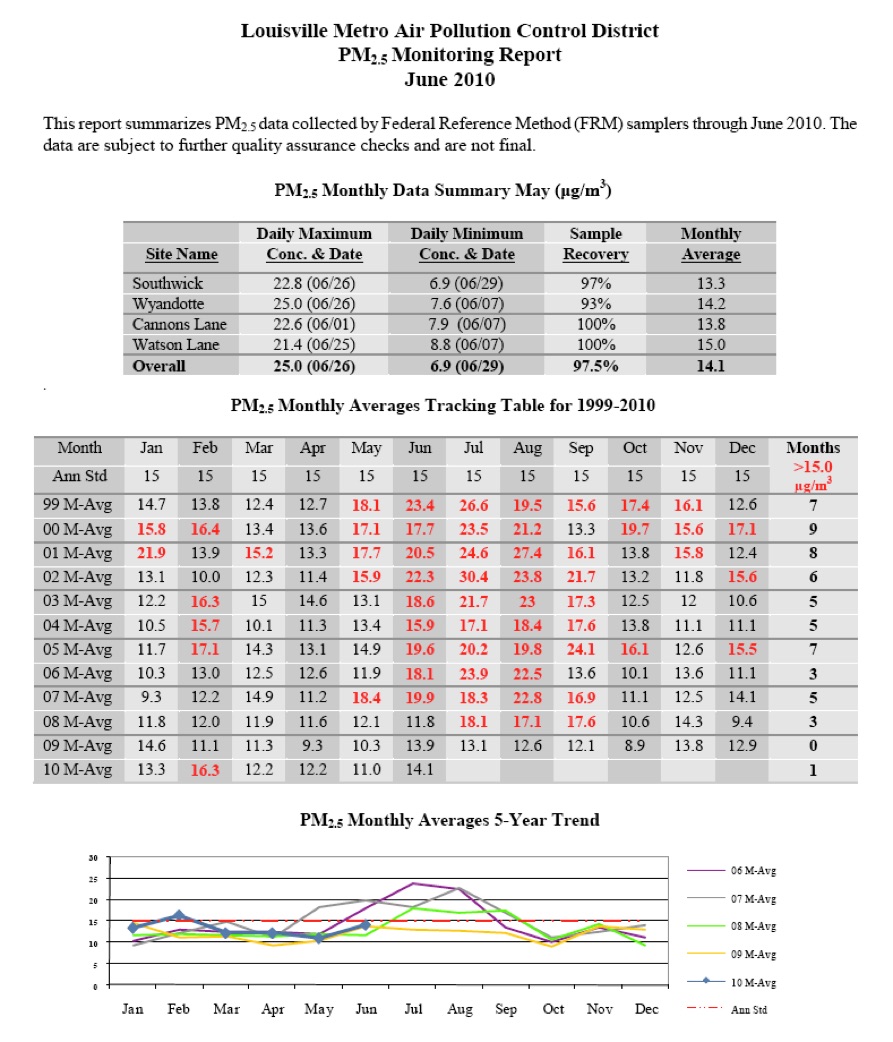
As a result of the 2005 PM2.5 designations, U.S. EPA designated the Louisville, KY-IN area nonattainment for the 15.0 μg/m3 annual standard and KYDAQ was required to develop a plan to reduce oxides of nitrogen (NOx), sulfur dioxide (SO2) and direct PM2.5 emissions and to demonstrate that the area will meet the federal annual air quality standard by April 5, 2010.
Kentucky’s main PM2.5 components are primary particles (organic carbon, crustal material, and elemental carbon), SO2 and NOx, which were included in the attainment demonstration analysis. Volatile organic compounds (VOCs) and ammonia (NH3) were not included in the analysis since they were not part of Kentucky’s current attainment strategy for PM2.5 (although controls for VOCs have been implemented for ozone nonattainment). This is consistent with U.S. EPA’s Clean Air Particle Implementation Rule [72 FR 20586] (hereafter referred to as “Implementation Rule”). In the Implementation Rule, U.S. EPA presumes NH3 emissions are not a PM2.5 attainment plan precursor and that States are not required to address VOC unless the State or U.S. EPA makes technical demonstration that emissions of VOCs significantly contribute to nonattainment of the annual PM2.5 standard.
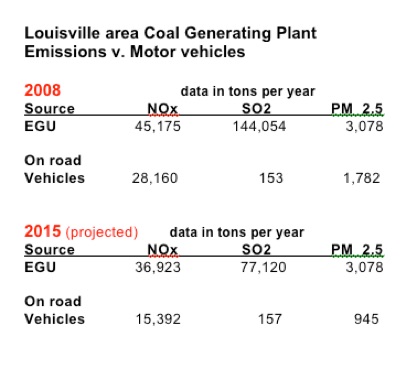
This chart is from the Jefferson County Air Pollution Control Board website