Published online at Louisville, Kentucky USA -
An independent, secular, contemporary journal of political and environmental issues dedicated to peaceful reduction of human impacts on Earth
Published online at Louisville, Kentucky USA -
An independent, secular, contemporary journal of political and environmental issues dedicated to peaceful reduction of human impacts on Earth

BadwaterJournal.com
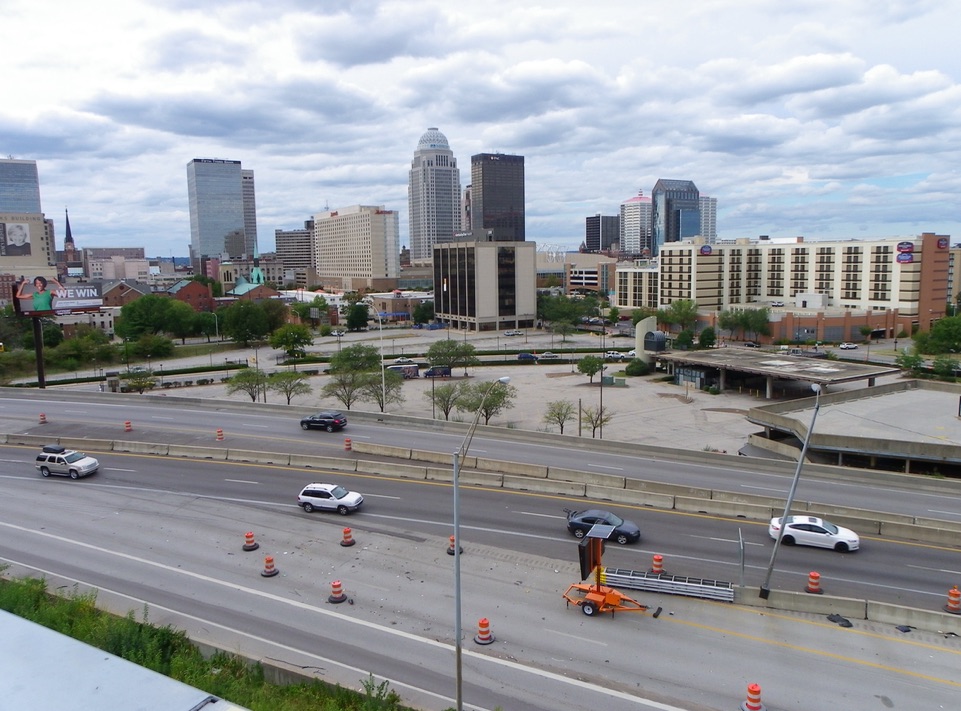
WHAT UNSUSTAINABLE URBAN GROWTH LOOKS LIKE
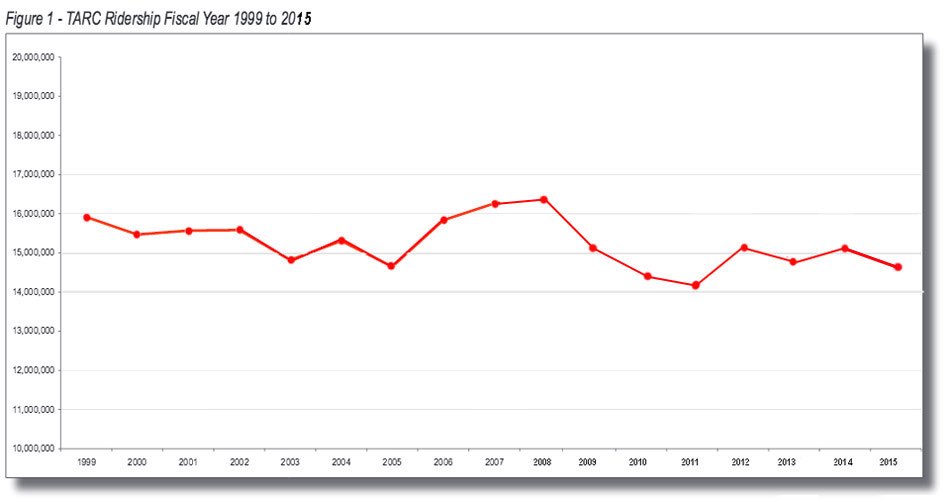
TARC - FY 2015 Budget
While FY15 promises to be a year of major, visible upgrades, largely resulting from federal grant funding, TARC continues to face significant operating revenue challenges. Limited operating revenue threatens TARC’s ability to maintain existing service let alone build a network that can meet community desires and needs. TARC, in fact, cannot currently fully meet demand.
TARC is focusing more and more on trying to secure increased operating revenue. . . .
Operating funding is not keeping pace with expenses to cover the local share of federal grants and increasing costs for items such as fuel, maintenance, health insurance and pensions. The budget is further strained because the amount of federal funding for the capital costs of operations relating to maintenance, tire leasing and contracting service, is also falling short of covering expenses.
TARC estimates total occupational tax revenue for fiscal year 2014 at $46 million, 1 percent more than the initial budget estimate. For fiscal year 2015, TARC is projecting an increase of 4 percent in that key source of operating funding, to $48 million. Meanwhile, expenses are rising at an estimated rate of 2 percent in FY15.
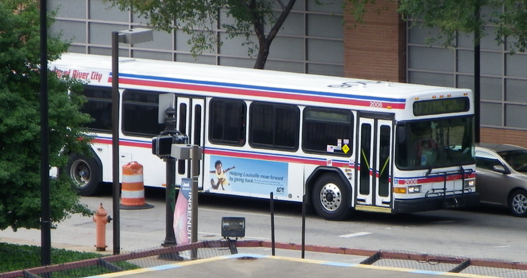
Transit Authority of River City (TARC)
Update / Progress Report, June 2014
TARC Funding and Environmental Justice
The onboard survey, performed on all TARC routes by IQS Research, which reported a margin of error for results of plus or minus three percentage points, showed:
· 55 percent of all passengers had a household income of less than $25,000 and an additional 27 percent had a household income of less than $35,000.
· Minorities comprise more than 60 percent of TARC passengers, with African-Americans being the single largest percentage of passengers, at 55 percent.
· 90 percent of TARC’s passengers use the service at least several times a week and 70 percent ride TARC every weekday or every day, suggesting a strong dependence on TARC for mobility.
· Some 40 percent of passengers use TARC to access jobs while 25 percent ride TARC for school purposes.
TARC3 - Survey results also showed that ridership on TARC3, a door-to-door service for people with disabilities, is also predominately low income and minority. Forty-one percent of TARC3 passengers are African American and 75 percent have household incomes of less than $25,000. Income levels are impacted by the fact that 41 percent of the ridership is 65 or older.
https://www.ridetarc.org/about/long-range-plan/
“This update is the first comprehensive review of the community’s transportation needs and options since 2006, when advanced transit options were removed from KIPDA’s long-range plan because of concerns about whether they could be funded. The projects — including the Light Rail Transportation Tomorrow project in the South Central corridor — were eliminated from active consideration in spite of some 500 letters and emails of protest from community residents.
To revive a Light Rail project or another advanced transit option, the report says, TARC would need to increase the local occupational license fee adding to the existing Mass Transit Trust Fund. TARC anticipates that an increase in the occupational tax — from .2% to .4% of every dollar earned — could generate approximately $40 million annually in local revenue dedicated to transit. This local investment in public transportation would provide TARC with stable, consistent funds for service expansion and provide the local matching funds that could leverage many sources of federal funds.”
TARC- Long Range Plan
TARC Short and Long-range Planning Goals
· TARC is working with KIPDA and Louisville Metro agencies on short and long range planning efforts to address community-wide mobility issues and promote sustainable transportation options in the Louisville Region. TARC is partnering in major transportation planning processes Move Louisville, Connecting Kentuckiana and the Downtown Mobility Plan to improve public transportation and cross-river mobility in the TARC service area. The ultimate goal is to provide mobility choices for all users and serve the community with an efficient and sustainable transportation system.
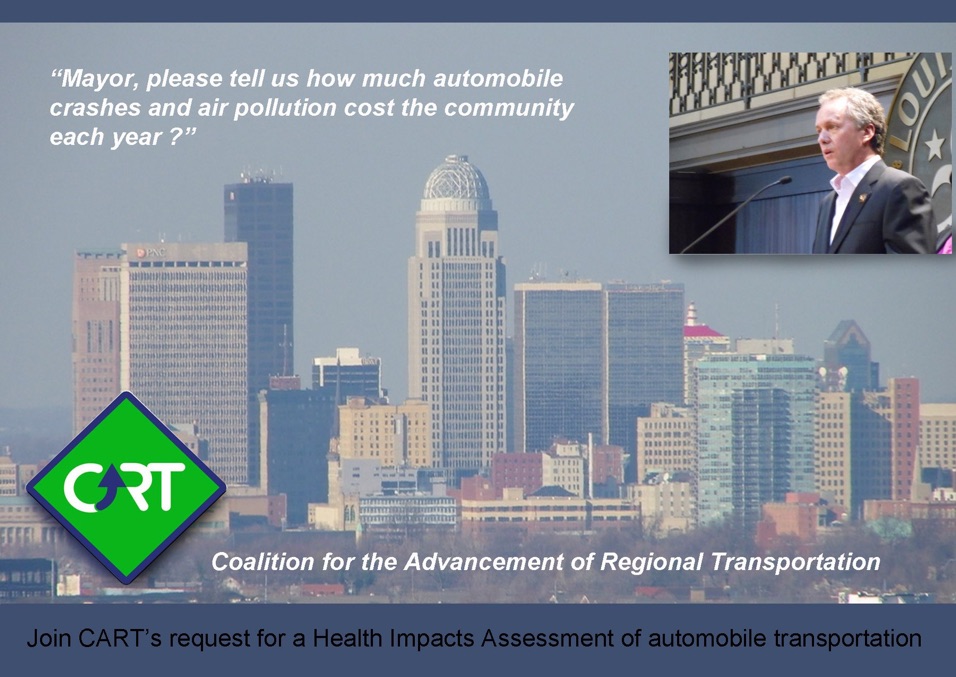
Louisville planners serve auto industry with polluting roads as TARC service dwindles
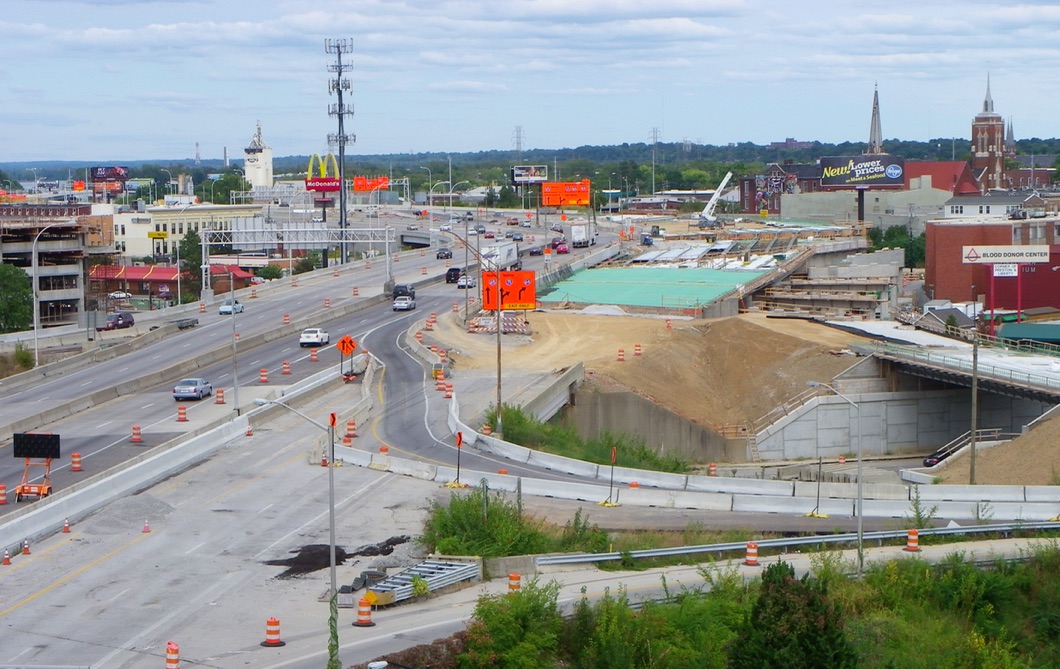
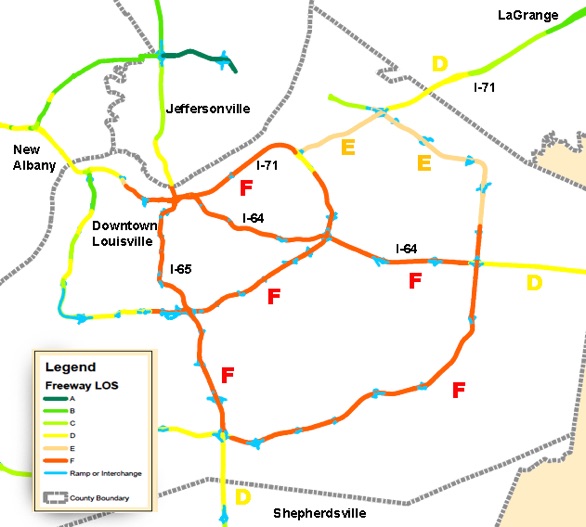
In late summer 2015, Louisville’s massive Ohio River Bridges Project lumbers towards completion in a dusty confusion of steel, concrete mixers and traffic bottlenecks. The $10 billion dollar municipal bond funded project will add acres of sun baked concrete to a Metro urban core already suffering with ‘heat island effect’ and cursed with a road system that delivers low levels of service, chronic congestion and the highest number of traffic fatalities and injures of any county in Kentucky.
The obvious question posed by the lines of backed up cars –each with a single driver tapping out “I’ll be late’ on his phone– is “why aren’t we building a light rail system to remove more vehicles from the congested roads?” A well planned light rail system, with incentives to build ridership, is a mode alternative that reduces both highway congestion and air pollution emissions. Many of our peer cities have light rail systems– Louisville has been out of compliance with Clean Air Act standards for ozone and particulates since 2004--more than a decade--with an untold social health burden in the billions of dollars.
KIPDA is finalizing “Connecting Kentuckiana’ the latest update to the Metropolitan Transportation Plan. Yet, KIPDA is not planning any light rail project, and TARC public transit bus service is being starved of funds by Metro government and the state so that it has to cut back service in a time when demand is rising. Why is Louisville hostile to light rail ?
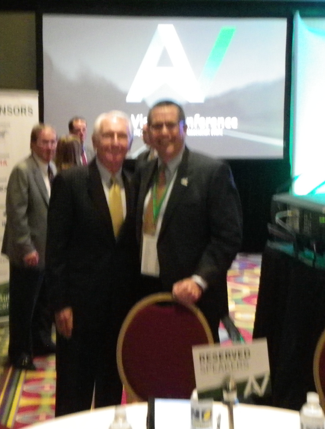
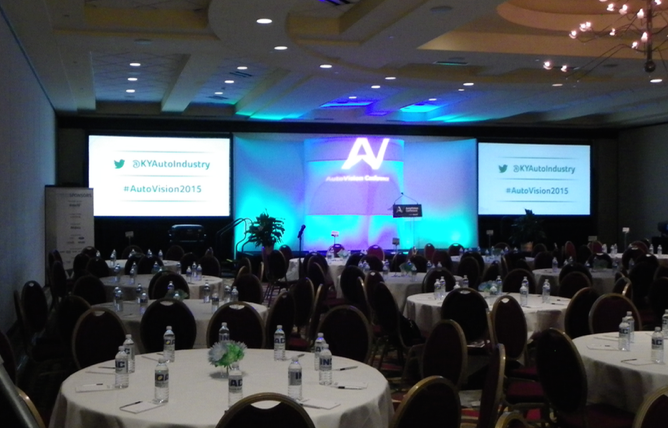
Ford and Toyota, their suppliers and related industries have been expanding in Kentucky and now provide some 136,500 jobs producing $ 5.6 billion in vehicles and parts in 2014. The automakers economic clout was on display at the recent Kentucky Automotive Industry Conference--AutoVision 2015. Governor Beshear and U.S. Department of Transportation officials shook hands with industry executives as they envisioned a driverless future.
© 2015 Bud Hixson
The futurists in the major auto design centers are looking at unsafe and congested roads, looking at mounting air pollution health hazards and fearing the logical conclusion that a larger share of the commuting public should be shifted to low or no pollution fixed rail systems. In response, they are proposing to replace drivers with artificial intelligent computer/software systems. I’m not joking.
Just a week after the AutoVision conference– touting a future of computer linked intelligent driverless cars– the Volkswagen scandal hit the media, describing how VW engineers used software to game the emissions testing on its diesel vehicles. The Kentucky automakers timed it right or they might have been explaining why the public should trust engineers to put artificial intelligence behind the wheel in light of the lies VW told its customers. ‘AutoVision’ and ‘Green Diesel‘ seem decanted from the same moonshine barrel. But I digress.
The automakers need a way to cram even more cars, more expensive cars, on the same roads that are fast reaching capacity or passing it. Having no shame at all, they are leading transportation planners to plan a road system paid for by the public that will have installed computer sensors, so that car to car digital linkage would allow computer controlled cars to bunch up in tight groups dubbed ‘platoons’ and race bumper to bumper down the highway avoiding deer and blown tires. Probably.
The ‘AutoVision’ hucksters propose highways dedicated or exclusively for computer controlled cars with regulatory changes requiring ‘retrofits’ to older models to achieve complete adoption of the computer highway system. They forecast social benefits in time saved because drivers will be able to read and work while the car zooms in platoons or waits for a wreck to clear. The naked market self-interest in such a proposal is of a piece with the VW scam that victimizes the unwitting buyer with ‘green diesel’ green wash.
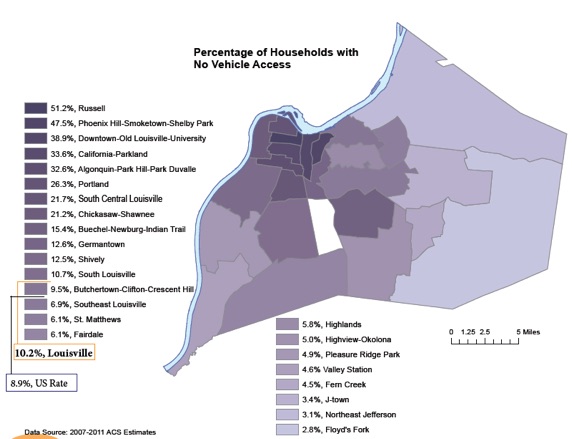
According to the 2014 Metro Health Equity Update 10.2 % of Louisville residents have no vehicle access. That equates to about 91,843 people. The TARC ridership averaged over 260 work days is more than 45,000 weekday trips.
The riders are disproportionately low income and minority race. The jobs they need are in the booming suburban industrial centers, the Ford Truck plant area, River Ridge across the river, Riverport in the southwest Jefferson. TARC service to these zones if it exists is lengthy and may require transfers. At the same time, thousands of commuters are driving single occupant SUVs, light trucks and passenger cars in a daily commute along I-71, I-64 and I-65 leading to rush hour congestion. KIPDA’s plans to widen major arteries will likely provide more space for car dealers to fill up and simply result in bigger jams, more delay and more emissions. Public transit needs upgrading.
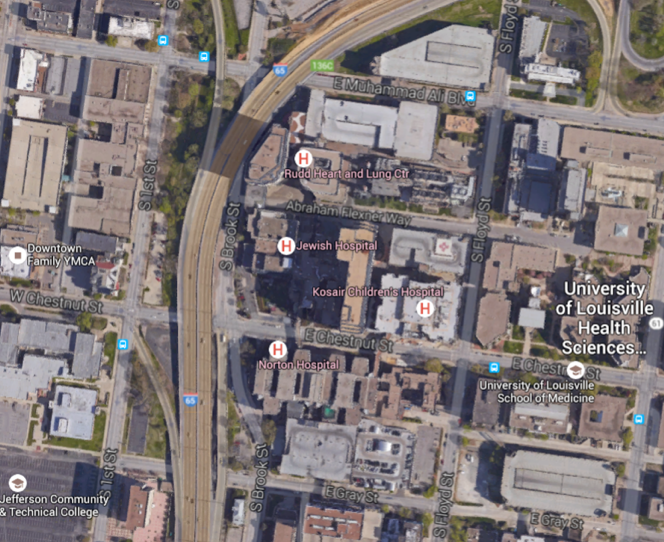
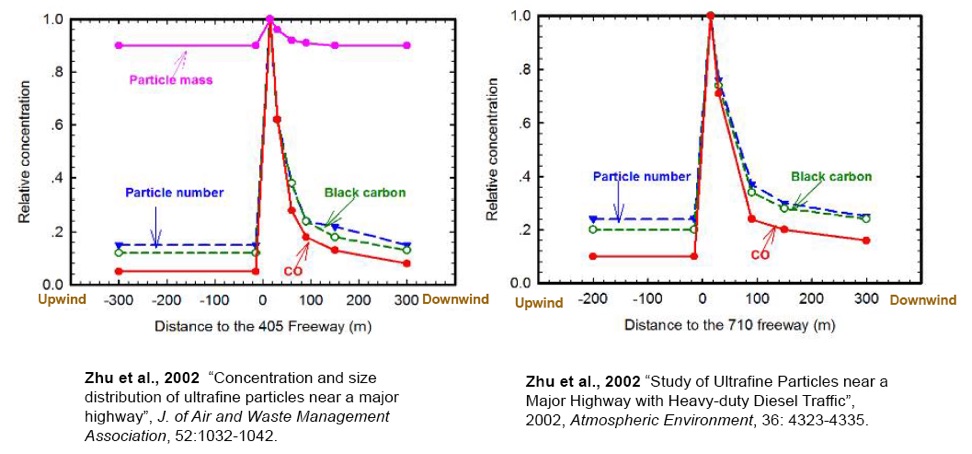
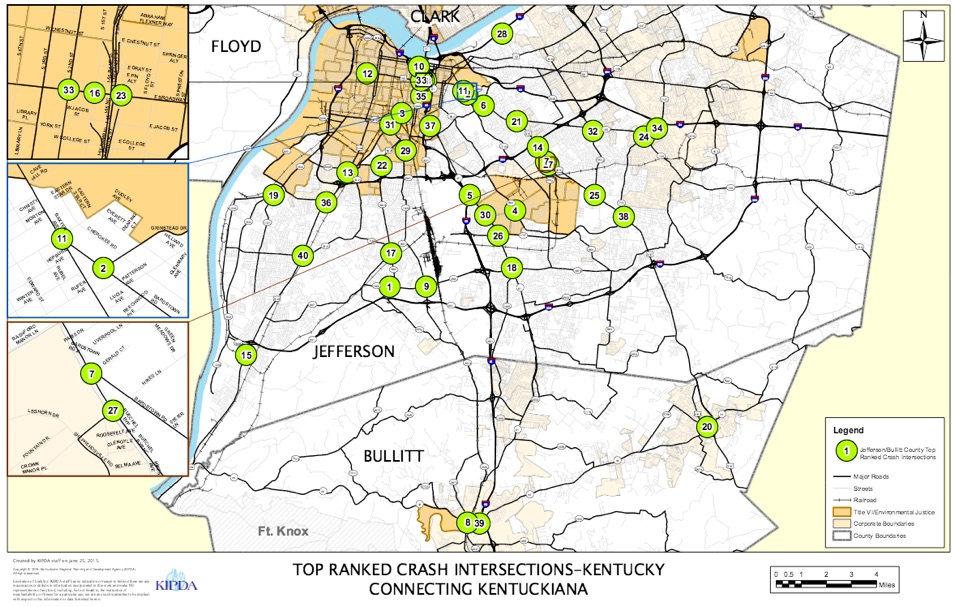
Why is KIPDA expanding the thousands of cars, diesel cars, heavy duty diesel trucks and other pollution emitters driving through the urban core? In hospital curve more than 100,000 cars per day pass respiratory and cardiovascular medical centers. These hospitals are within 300 meters of the heavy traffic artery– the zone where mobile source toxic emissions are concentrated. See the graph below. Particulates and carbon monoxide emissions create a concentrated pollution corridor downwind of interstates, and these emissions penetrate buildings.
EPA is putting out green wash that air pollution emissions are declining, but in fact, they are becoming more toxic. Modern engines emit smaller ultrafine particulates that evade detection by the coarse particulate methods used by EPA and Metro Air Pollution Control District. Particle numbers tell the real story. Dense clouds of ultrafine particulates surround highway corridors and have real health impacts both respiratory and cardio-vascular. These impacts add up to billions of dollars in hospital admissions and premature deaths each year.
No cars in the house
Source: 2014 Metro
Health Equity Update
FORD
AMAZON
FORD
RIVER-
PORT
UPS
Why is KIPDA expanding the thousands of cars, diesel cars, heavy duty diesel trucks and other pollution emitters driving through the urban core? Why are all the major projects in the Transportation Improvement Plan and the Metropolitan Transportation Plan major road widening projects costing millions of dollars?
It can’t be because building a light rail system would cost too much. The hundreds of millions of dollars per year that our community pays because of congestion, road crash fatalities and injuries make the single operator vehicle system the most costly and lethal mode of transportation going. Planners know light rail has less than 1/26 the accident rate of cars.
At the AutoVision 2015 Conference I should have asked Governor Beshear why light rail and inter-city high speed rail have no chance in Kentucky. But, at the time, he was surrounded by auto industry executives.
https://www.beairawaremn.org/who-is-affected/disparities
See the Minnesota study on the costs and impacts of transportation air pollution:
“About 6-13% of all metro residents who died, and about 2-5% of all metro residents who visited the hospital or emergency room for heart and lung problems, did so partly because of exposure to fine particles in the air or ground-level ozone.”
“Groups most affected by air pollution were populations with higher rates of heart and lung disease, including people of color, the elderly, children with uncontrolled asthma, and people in poverty.”
https://louisvilleky.gov/government/health-wellness/public-health-data-reports
“Access to reliable transportation is especially important in those areas that have dense unemployment. As shown in the unemployment map, areas of low vehicle ownership correlate with areas of unemployment. These vulnerable populations are dependent on public transportation to get to employment. This can limit job opportunities, due to lack of service, travel time or other factors. Reliable transportation is also highly important in areas affected by real and/or perceived
crime, limiting ventures on foot or bicycle. This further compounds the effect of lack of independent transportation by keeping people inside their homes and reducing active lifestyle opportunities for fear of their surroundings. For many people in these areas, owning a car is not financially feasible. This underscores the need for effective and efficient public transportation, especially for these areas with low rates of vehicle ownership.”
Left: Governor Beshear at AutoVision 2015
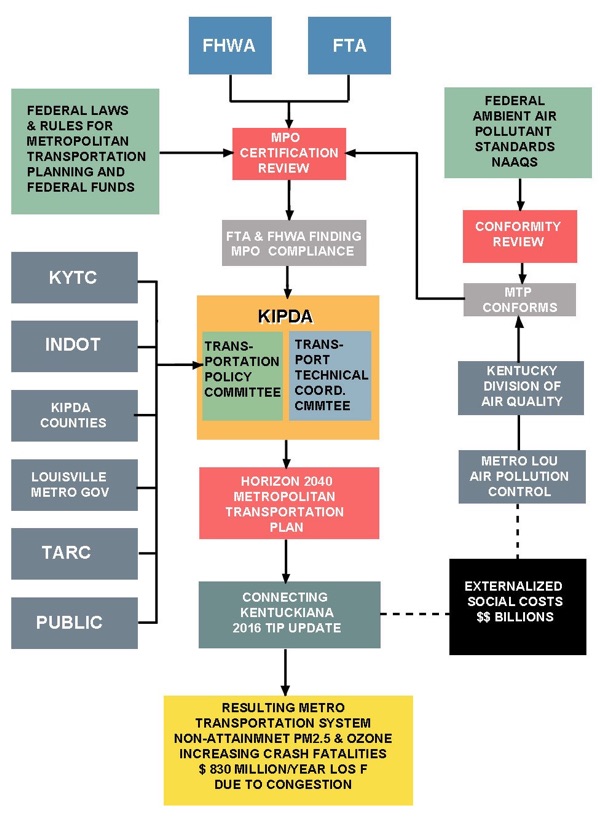
Adapted from KIPDA Congestion
Management Plan Overview
Metropolitan Plan formulation sequence
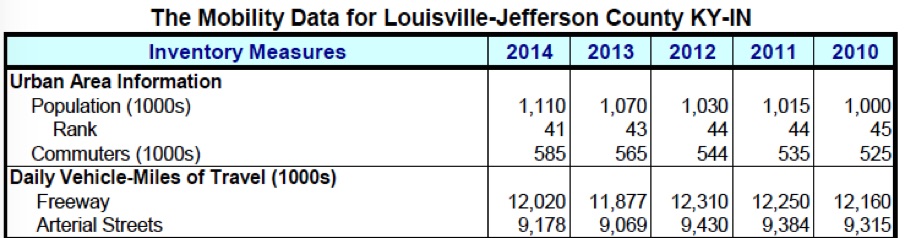
Source: TARC Budget
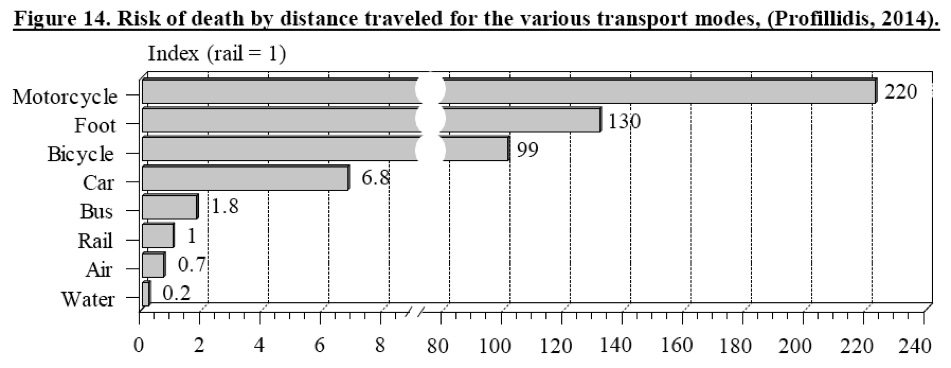
Source: Yifang Zhu, Ultrafine Particles on and near Roadways:
Exposure Assessment and Mechanism Understanding
Source: National Highway Traffic Safety Administration
“After robust ridership growth from FY11, with 14.1 million customers, to FY12 with 15.2
million customers, TARC’s ridership decreased slightly in FY13 to 14.97 million customers or
46,700 average weekday trips.”
The FY 2015 number is 14,620,979.
KIPDA - Congestion Management Plan Overview Page 13
"Whereas the Texas Traffic Institute analysis provides a measure of past and current congestion, estimates of future system level performance measures can be derived from the travel demand forecasting model. For example, the Horizon 2030 Plan analysis indicated that vehicle miles of travel are expected to increase by 54% between the 2000 base year and the 2030 horizon year. The projects, programs, and services which are part of the plan serve to mitigate the congestion level that would occur without them."
But, Metro Government Sustain program doesn't report that KIPDA forecasts between 22% and 54 % increase in VMT and instead states a goal of reducing VMT by 20% by 2025.
https://louisvilleky.gov/government/sustain-louisville/goal-8-reduce-vehicle-miles-traveled-20-2025
Goal 8. Reduce vehicle miles traveled 20% by 2025
KYTC reported 19.7 million daily VMT in Louisville in 2006 and the goal target is 15.7 million daily VMT by 2015.
· In 2013 32,719 people died in motor vehicle crashes,
down 3.1 percent from 33,782 in 2012.
“In 2010, there were 32,999 people killed,
3.9 million were injured, and
24 million vehicles were damaged
– in motor vehicle crashes in the United States.
The economic costs of these crashes totaled $242 billion. Included in these losses are lost productivity, medical costs, legal and court costs, emergency service costs (EMS), insurance administration costs, congestion costs, property damage, and workplace losses. The $242 billion cost of motor vehicle crashes represents the equivalent of nearly $784 for each of the 308.7 million people living in the United States, and 1.6 percent of the $14.96 trillion real U.S. Gross Domestic Product for 2010.”
Blincoe, L. J., Miller, T. R., Zaloshnja, E., & Lawrence, B. A. (2015, May). The economic and societal impact of motor vehicle crashes, 2010. (Revised) (Report No. DOT HS 812 013). Washington, DC: National Highway Traffic Safety Administration.
TARC
SINGLE OCCUPANT VEHICLE
LIGHT RAIL
Source: TEXAS TRANSPORTATION INSTITUTE
TARC IN DECLINE
TRANSPORTATION
AIR POLLUTION
LINK OUT:
http://kipda.org/Transportation/MPO/TPC.aspx
The Transportation Policy Committee-
This is the group of political leaders and agency officials that considers and authorizes the Metropolitan Transportation Plan that favors auto-makers, pollutes the air, suppresses public transit and cost $ 860 million per year in congestion costs.
One plan for the public –another for the plutocrats
TRANSIT VISION and
Transportation Project REALITY in Louisville
The reality gap –between the vision of future transportation purveyed at public meetings –and the actuality of what the GOVERNMENT is planning to build –is vast. That reality gap is becoming so familiar in a city where public relations have become untethered from facts and accountability.
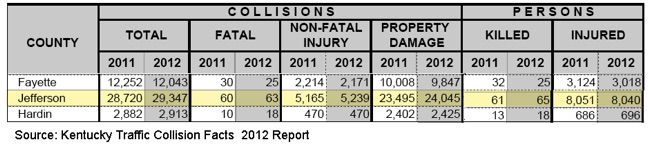
The opinion shapers have no shame and no fear and for a dollar will put a spin on anything. Never mind that children are gasping from asthma, that poor people are waiting for buses that take too long to get to job centers and 8,000 people are injured in car wrecks in Jefferson County every year. We are “connected, creative, compassionate and competitive.” Add “corrupt” to that.
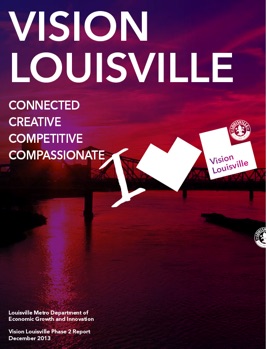
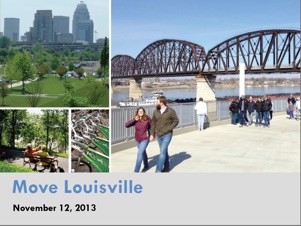
Move Louisville, Vision Louisville and Downtown Mobility purport to be forward thinking planning exercises with an open ear to public transit enhancement. The pages and powerpoint slideshows visit fondly our trolley history and then offer glimpses of light rail vehicles and possible routes, as if sustainable, low emissions light rail was on the drawing board–somewhere. Its not.
MAP 21, the federal transportation law requires MPOs like KIPDA to pay lip service to progressive transportation planning ideas. But federal agents regularly approve Louisville’s and the states MTP transportation plans despite our history of racist segregation and lack of access for the poor, and despite Louisville violating air pollution standards for ozone and particulate. Light rail could solve these problems but– that doesn’t sell gasoline.
MAP 21 includes transportation planning factors that local MPOs are supposed to be guided by–in response KIPDA has adopted ‘regional priorities’ that include, “Increase strategies that reduce the demand placed on roadways and interstates by single occupant vehicles,” and, “improve air quality.”
Yet looking through the 2015-2018 Transportation Improvement Program –the TIP- of funded projects, Louisville and KIPDA are not funding significant transit expansion, much less planning to build any light rail system. Their projects will increase congestion and air pollution from single occupant vehicles. Metro and KIPDA are feeding the gullible ‘urbanist’ crowd what they want to hear, counting on their lack of spine and short memories. The urbanists ideals seem to be satisfied by regular bourbon tasting events where we laud ourselves as visionary in some way or another.
Mayor Fischer’s and Louisville’s Downtown Partnership’ Downtown Mobility plan exists in a world where ozone and particulate violations are no matter and where congestion is best addressed by widening interstates and increasing single occupant vehicle travel.
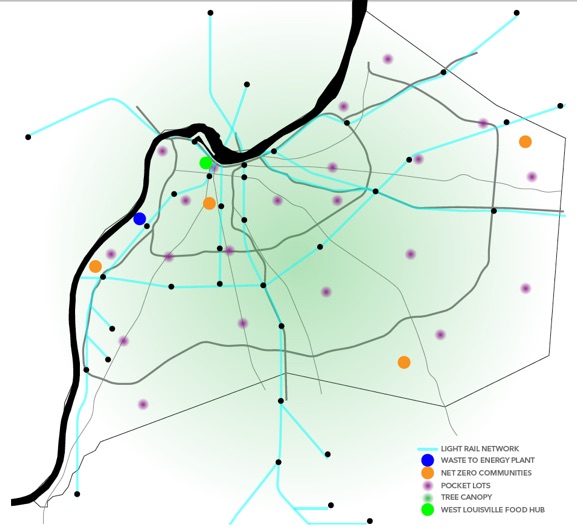
The map at right from Vision Louisville shows a light rail network following major transportation corridors and dotted with local stops. This is pure fantasy. Neither KIPDA, the state, or Louisville is bringing forward any such plan to actually build a light rail network.
Just the opposite. The transportation funded projects in the TIP are mostly multi-million dollar concrete highway expansions. No real plan to shift to transit a significant portion of the 70,000 commuters into and out of Downtown each day is being planned or funded. TARC will be held on a starvation budget through 2040. TARC is not complaining either. From the TIP budget, a total of 15 Protera all electric ‘zero emissions’ buses will be purchased, while some 72 diesel fuel combustion route buses will be purchased.
Probably the most actually progressive urban agency in the Metro, yet TARC can’t cut the cord to the vested interests that sell it $ 5.4 million worth of diesel fuel every year.
If Louisville was the “Enterprise,” the command and control panel would be lit up with blinking red lights and the crew would be bracing for impact. But our crew is sipping bourbon and emitting ethanol fumes. We are watching slide shows that envision what it would be like to escape the Klingons, rather than actually taking defensive action.
Rational planning for a creative, compassionate, connected Metro Louisville would begin to shift 30% or some 20,000 daily commuters to a light rail system in the shortest time possible. That would remove 20,000 cars from the interstates and solve the rush hour congestion problem without buying more tons of concrete. It would reduce vehicle miles traveled and thereby reduce ozone and particulate emissions. It could creatively be powered by hydro-electric power using the Ohio River instead of fossil fuel.
But instead, we are going to increase congestion and cars. We will likely have to begin to regulate the “Angel’s share’ emissions of ethanol from regional bourbon warehouses to control ozone.
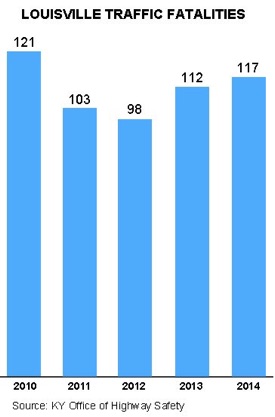
117 traffic fatalities and 8,000 traffic injuries every year are estimated to impose a social burden of
$ 3.6 billion dollars on Louisville for treatment, hospitalization, lost work and rehabilitation. Where is the competitiveness in that ? The Texas Transportation Institute modeled Louisville wasting
$ 860 million per year in congestion costs. Together traffic crashes and congestion costs add up to $ 4.5 billion per year in wasted dollars.
TARC’s annual operating budget to move an average of 46,700 riders each day is only $ 77 million. Thats 1/58th of the dollars we waste on the single occupant vehicle system each year. Its only logical to build light rail.
These materials are from Move Louisville and Vision Louisville documents avaliable for download
https://louisvilleky.gov/government/advanced-planning/move-louisville
Route Map of hypothetical light
rail line from Vision Louisville
Phase 2
Move Louisville slide
Vision
Louisville
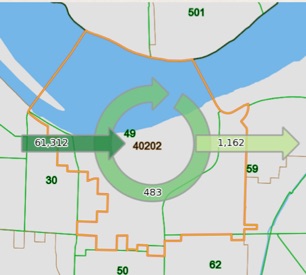
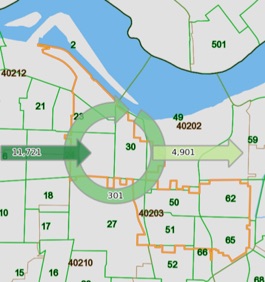
40202 and 40203 daily commuter traffic of 70,000 in and out of town from Downtown Mobility plan
Louisville Wastes
$ 4,498,500,000 per year
in traffic crash costs and
congestion costs
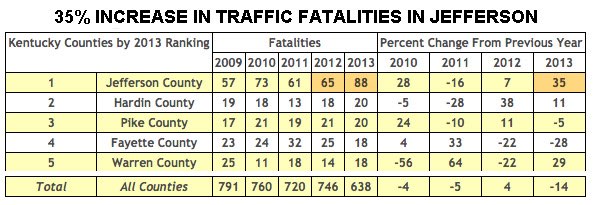
In 2012, the Kentucky State Police estimated the cost of 746 Kentucky crash fatalities at $ 2.1 billion economic and the
comprehensive cost at $ 5.6 billion.
http://www.kentuckystatepolice.org/tip.html
KSP used a VSL- Value of Statistical Life of $ 4,459,000 to reach the comprehensive cost of $ 5.6 billion for 746 statewide fatalities.
As of October 21, 2015 there are 582 reported crash fatalities statewide.
The Federal Department of Transportation released guidance for VSL calculations in regulatory considerations in 2015 adopting $ 9.4 million as the Value of Statistical life.
The guidance also provided multipliers for estimating the social cost of serious and minor injuries.
Using a 30/70 Serious v. minor injury split
to estimate the social cost of crash injuries in Jefferson County.
DOT approved VSL is $ 9.4 million for crash fatality
DOT approved Serious Injury cost is $ 987,000 based on multiplier (.105) and minor injury (.003) is $ 28,200.
117 Crash Fatalities recorded in Louisville in 2014 X $ VSL 9.4 million = $ 1,099,800,000 comprehensive value
8,040 Crash Injuries in 2012 using 30 % serious and 70% minor = Minor (.003 X $ 9.4 million) = $ 28,200 X (.70 X 8,040) =
$ 158.7 million annual minor crash injury costs
Serious (.105 X $ 9.4 million) = $ 987,000 X (.30 X 8,040) =
$ 2.380 billion annual serious injury costs
Total annual social cost burden injuries plus fatalities =
$ 3,638,500,000 using $ 9.4 million VSL and Louisville statistics for 2014/2012
Add to that $ 860,000,000 in annual wasted time and fuel from traffic congestion = $ 4,498,500,000 annual waste.
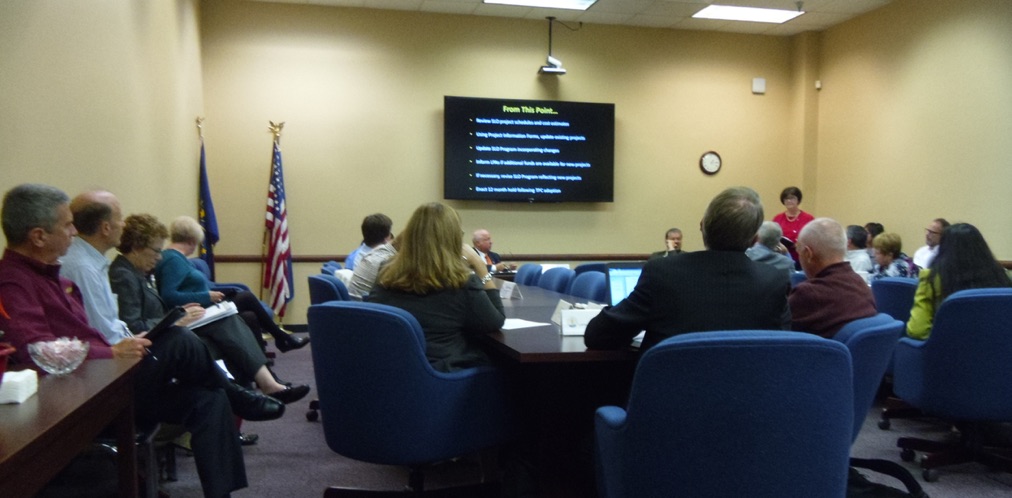
KIPDA- Transportation Technical
Coordinating Committee
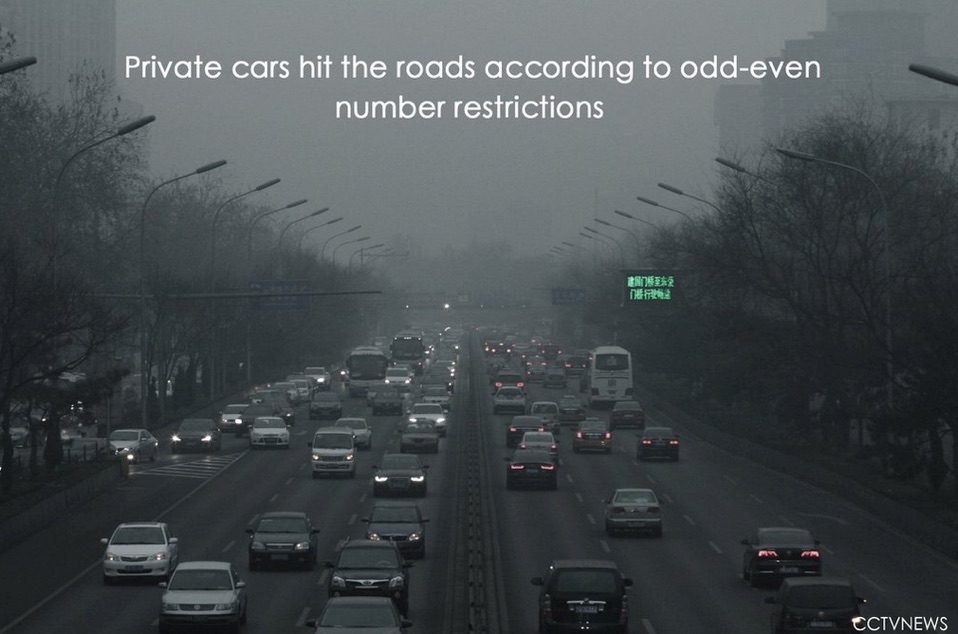
https://twitter.com/cctvnews/status/674094668318019584/photo/1?ref_src=twsrc^tfw
China Central News photo
Source: Yifang Zhu, Ultrafine Particles on and near Roadways:
Exposure Assessment and Mechanism Understanding