Road Salt
BadwaterJournal.com
WHAT UNSUSTAINABLE URBAN GROWTH LOOKS LIKE
Published online at Louisville, Kentucky USA -
An independent, secular, contemporary journal of political and environmental issues dedicated to peaceful reduction of human impacts on Earth


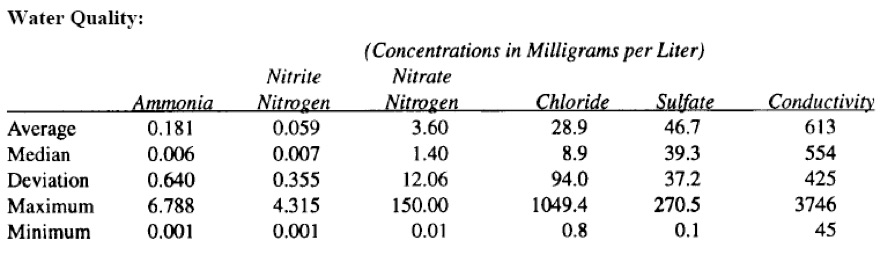
The U.S. Environmental Protection Agency (EPA) has
established water quality standards for chloride for the
protection of aquatic life.
Water bodies are considered “impaired” if these standards are violated.
The water quality standard for chronic exposures is a four-day average concentration of 230 mg/ L not to be exceeded more than once every three years. The water quality standard for acute exposures is 860 mg/L for a one-hour average with a similar three year recurrence interval.
Effect on the Environment
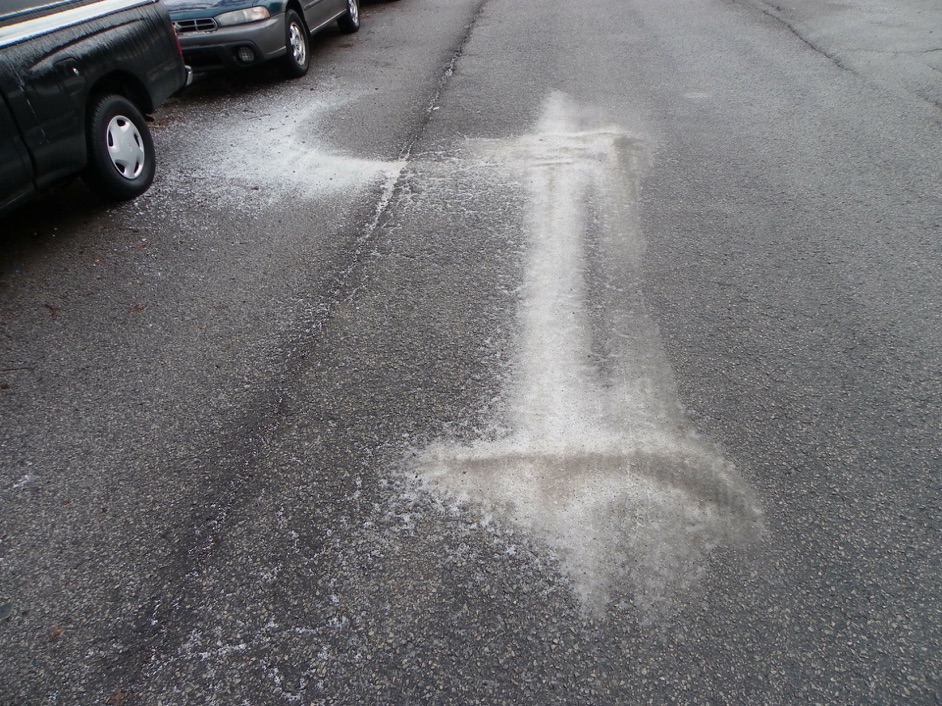
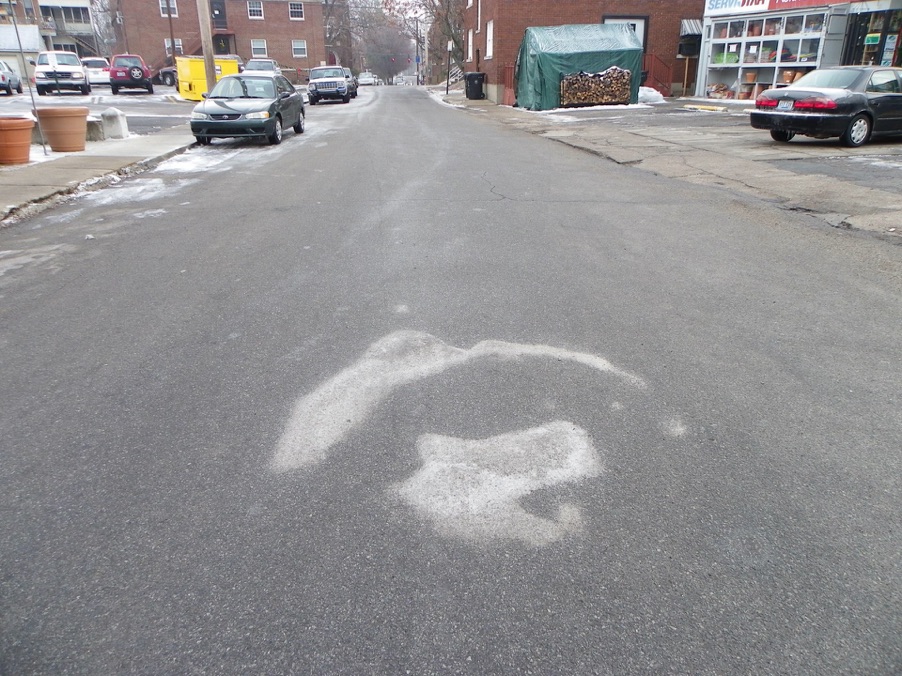
Aquatic Biota. Road-salt loadings in surface waters vary with regional climate conditions, season, and air temperature fluctuation. Snowmelt may proceed gradually overall, but it increases dramatically following application of road salt. Shock loads of salt to aquatic ecosystems might last less than a day following application, with concentration decreasing thereafter. Salt held in solution in snow or deposited on surface soil layers is readily dissolved by rain and can be transported to receiving waters in runoff. Prolonged retention of salt in streambeds or lakebeds decreases dissolved oxygen and can increase nutrient loading, which in turn promotes eutrophication.
Toxicity responses of aquatic organisms to NaCl vary. Laboratory studies report that the LC50 for six freshwater fish and crustacean species exposed to NaCl for one day ranged from 2,724 to 14,100 mg/l with a mean of 7,115 mg/l (Cowgill et al., 1990). These values decreased significantly as exposure time increased. The LC50 for 17 species of fish, amphibians, and crustaceans exposed to NaCl for seven days ranged from 1,440 to 6,031 mg/l with a mean of 3,345 mg/l (EC, 2000).
Reports of chloride concentrations in highway runoff run as high as 19,135 mg/l. Salt tolerance of fishes ranges from 400 to 30,000 mg/l, greater than the salt concentration of seawater. A seven-day exposure of 1,000 mg/l is lethal to rainbow trout (NRC, 1991). While an estimated 10% of aquatic species will exceed their critical tolerance values for chloride with prolonged exposure to concentrations above 220 mg/l, many of the macroinvertebrates upon which the more tolerant species feed might exhibit lower tolerances. Stream studies in northern New York revealed that benthic diversity decreases as salinity increases and dominance of salt-tolerant invertebrates is synchronous with periods of road-salt application. Salinity stresses the periphyton community upon which benthic grazers forage and inhibits microbial processing of leaf litter (EC, 2000). Reduction of primary productivity causes repercussions at the top of the food chain in addition to the stress salinity imposes on the organisms themselves. The presence of salt in aquatic ecosystems also releases toxic metals from sediment into the water column and impairs distribution and cycling of oxygen and nutrients.
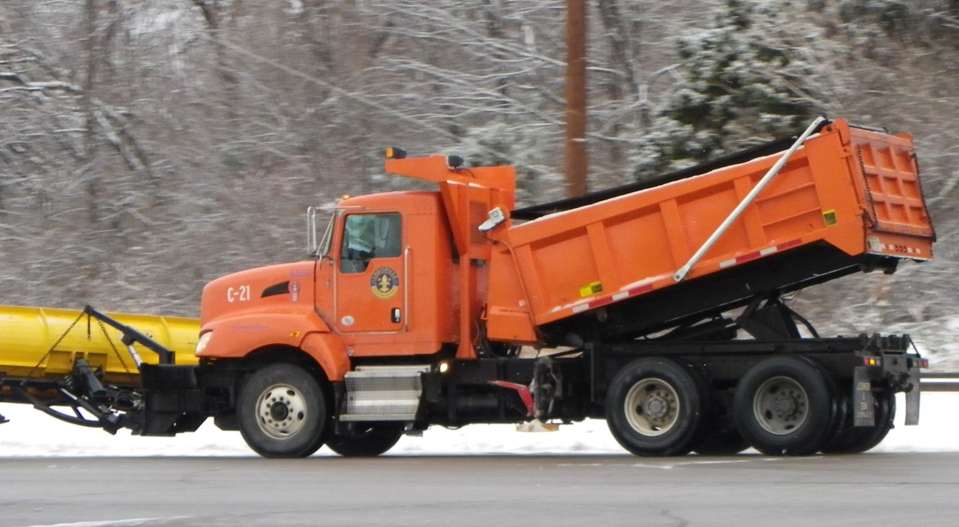
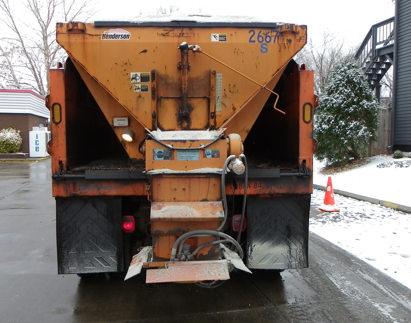
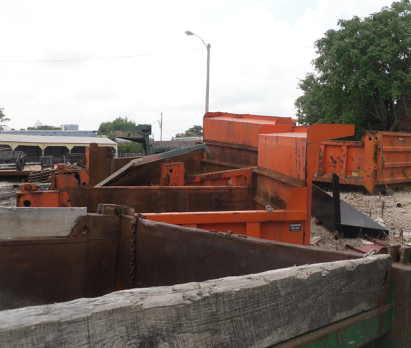
New salt spreader trucks
<http://pubs.acs.org/doi/abs/10.1021/es101333u>
A Fresh Look at Road Salt: Aquatic Toxicity and Water-Quality Impacts on Local, Regional, and National Scales
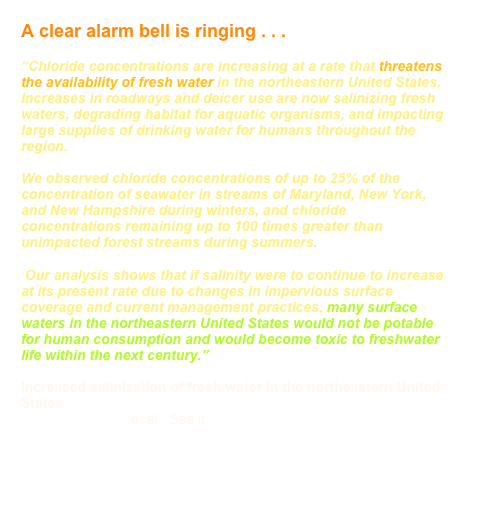
“Road-salt runoff poses an increasing threat to aquatic ecosystems that are influenced by urban land use and transportation corridors. Four broad issues suggest that roadsalt runoff is a serious and increasing threat to the nation’s receiving waters.
First, there is a multitude of historical evidence documenting detrimental effects of road salt on water chemistry and aquatic life . . .
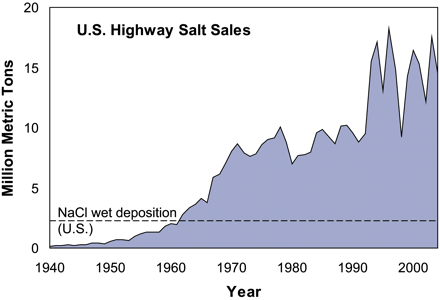
Second, road salt usage in the United States has increased steadily beginning in the 1940s through the current decade . . .
Third, urban development is increasing each year (10), which increases the amount of impervious area on which winter deicing operations are conducted . . .
Fourth, chloride, and to a large degree sodium, the two primary ions in road salt, remain in solution, making it difficult with present-day technology to design effective management practices for reduction of road-salt loadings to receiving waters after application.
Currently, reduction in usage appears to be the only effective road-salt-runoff management strategy.”
Key Findings:
Nationally: During the winter, samples from fifty-five percent of northern streams in this study had chloride levels that exceeded USEPA chronic water-quality criteria, indicating potential toxicity. Samples from twenty-five percent of the streams exceeded acute water-quality criteria.
Regionally: In eastern and south-central Wisconsin, potential toxicity was found during winter at all urban streams studied, with lingering effects at some streams in the summer.
-
•During winter, 100 percent of the streams monitored had chloride levels that exceeded the USEPA chronic water quality criteria with fifty-five percent of samples exceeding acute water quality criteria.
-
•Chloride levels higher than 10,000 milligrams per liter were observed at times during winter de-icing periods—much greater than the chronic water-quality criteria of 230 milligrams per liter and the acute criteria of 860 milligrams per liter.
-
•Chloride levels increased as urbanization percentage in the watershed increased.
Locally: In Milwaukee, more than half of the samples collected from streams during winter de-icing periods were toxic.
-
•Samples from seven of 13 streams collected during 2007 de-icing periods were toxic in bioassay tests.
-
•Chloride levels in 12 out of these 13 streams exceeded USEPA chronic water quality criteria; eight of 13 exceeded acute criteria.
-
•In long-term testing of one Milwaukee stream between 1997 and 2008, seventy-two percent of 38 samples collected during the winter were toxic in bioassay tests.
This USGS report is published in the journal Environmental Science and Technology and is available as a free download online at http://pubs.acs.org/doi/abs/10.1021/es101333u.
There are a variety of environmental tests that may be or have been specified for use with liquid or solid ice-control products. Many agencies, for example, limit the amount of various constituents to certain levels (typically expressed in allowable parts per million of the constituent). The PNS, for example, limits amounts of Arsenic, Barium, Cadmium, Chromium, Copper, Lead, Mercury, Selenium, Zinc, Phosphorus and Cyanide.
Tests for these are standard and if an agency is subject to limitations in regard to these or other constituents, then all suppliers should be required to provide proof that their product does indeed satisfy these limitations.
Kentucky uses 415,000 tons of road salt
with toxic anti-caking agents
Courier-Journal reported: Kentucky transportation cabinet orders more salt January 31, 2011
“WPSD-TV in Paducah reports the Kentucky Transportation Cabinet will get another 15,000 tons of salt from Kansas City and will distribute it statewide.
Transportation Cabinet spokesman Keith Todd says the state has used more than 400,000 tons of salt so far this winter — about 24,000 tons more than was used all of last winter. Todd says the state orders salt periodically to match the amounts used for each snowstorm.”
Road salt uses cyanide compounds as an anti-caking agent. 415,000 tons of salt spilled on state roads will cause many fresh water streams to exceed 230 mg/L concentrations of chloride that has been adopted standard as protective of freshwater habitat. Fishermen, people that enjoy wild and rural Kentucky should oppose and complain about Kentucky's salt poisoning of freshwater streams and groundwater with 415,000 TONS of road salt. Don't scratch your head and wonder where the fish and birds went?
http://www.cee.vt.edu/ewr/environmental/teach/gwprimer/roadsalt/roadsalt.html
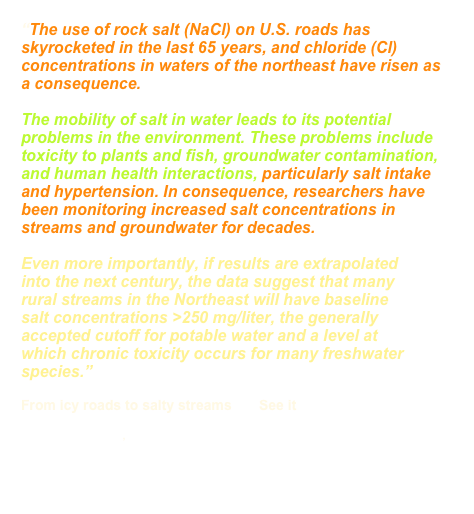
Salt concentrations build up over many years and remain high in the soil and groundwater. Groundwater seeping into streams often keeps water flowing during the driest periods, typically in summer. If the groundwater is salty, the stream will be salty. Increases in groundwater salinity have indeed been observed in the northeastern U.S. and Canada (11, 12). For example, a survey of 23 springs in the greater Toronto area found Cl concentrations topping 1,200 mg·liter-1 arising from road salt use (11). This groundwater salinity is the primary concern for long-term potable water supply. Once groundwater becomes salty, it typically will take decades to centuries for the salts to disappear, even when road salt use ends.
Many Urban Streams Harmful to Aquatic Life Following Winter Pavement De-Icing:
The use of salt to de-ice pavement can leave urban streams toxic to aquatic life, according to a new U.S. Geological Survey study on the influence of winter runoff in northern U.S. cities, with a special focus on eastern Wisconsin and Milwaukee.
More than half of the Milwaukee streams included in this study had samples that were toxic during winter de-icing. In eastern and southern Wisconsin, all streams studied had potentially toxic chloride concentrations during winter, with lingering effects into the summer at some streams. Nationally, samples from fifty-five percent of streams studied in 13 northern cities were potentially toxic; twenty-five percent of the streams had samples that exceeded acute water quality criteria.
Toxicity was measured by direct testing of organisms in samples during the local study component; in the regional and the national study components, observed chloride levels were used to assess potential toxicity.
"While winter driving and walking safety are the priority in treating pavements, this study suggests the need for advancements that will reduce salt loads to surface waters without compromising safety," said Matthew C. Larsen, USGS Associate Director for Water.
"We expected to see elevated chloride levels in streams near northern cities during the winter months," said Steve Corsi of the USGS Wisconsin Water Science Center. "The surprise was the number of streams exceeding toxic levels and how high the concentrations were," said Corsi, who led the study.
"This study shows that chloride contamination of urban streams is a problem in many places; it's not just a Milwaukee problem," said Corsi.
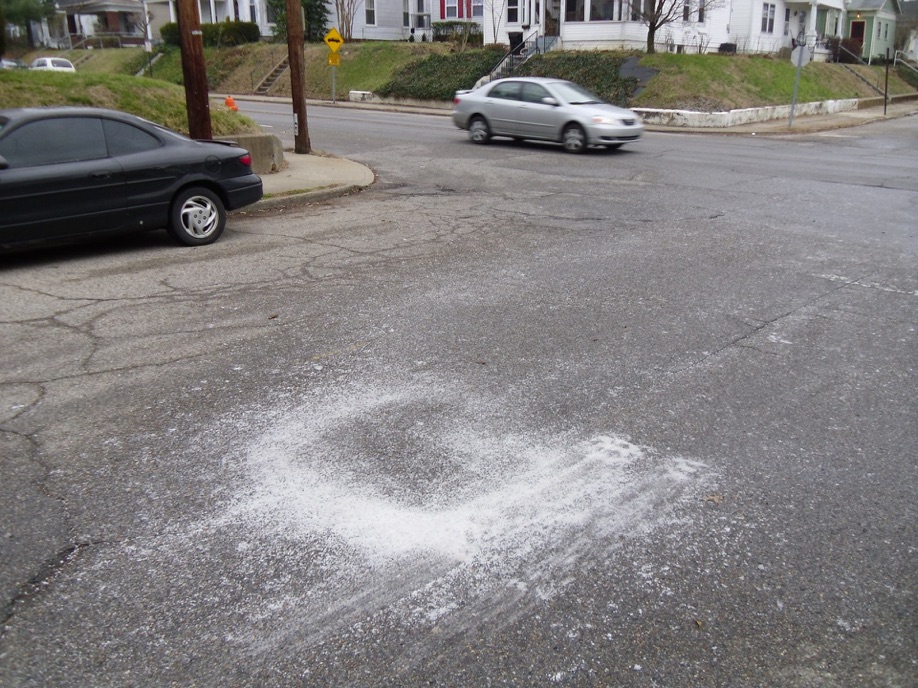
While road de-icing accounts for a significant portion of salt applications, it is not the only source. Salt is also used by many public and private organizations and individuals to de-ice parking lots, walkways and driveways.
Corrosion of bridges
“The massive spreading of salt on roads and highways unfortunately has also some serious negative effects. Besides environmental concerns, one of the major criticisms of salt use for deicing is its contribution to corrosion of metal in steel bridges, road vehicles, reinforced concrete (bridge decks, parking garages), and any other metallic objects in close proximity to roads and highways (lampposts, statues, etc.).
Although another effective but less corrosive deicing agent is commercially available (calcium magnesium acetate or CMA), its price is apparently too high for wide usage. One ton of CMA costs $300-600 as opposed to $20-70 for rock salt. The use of CMA has thus been confined to areas where corrosion could cause critically important damage such as for airport winter maintenance. It can therefore be expected that the road environment will likely remain corrosive well into the future.”
<http://www.cargill.com/products/industrial/winter/cg-90/index.jsp>
Cargill website on deicing salts
[PDF]
Deicing Salt – Recognizing The Corrosion Threat
File Format: PDF/Adobe Acrobat
Deicing salt corrosion can cause unexpected problems that are easy to avoid. The first step is to determine whether deicing salt is ...
www.imoa.info/_files/pdf/DeicingSalt.pdf
[PDF]
1 CORROSION OF DEICERS TO METALS IN TRANSPORTATION INFRASTRUCTURE ...
File Format: PDF/Adobe Acrobat - Quick View
by X Shi - Cited by 4 - Related articles
identified the deicer corrosion to steel rebar as the primary concern, followed by .... 2.1.2 Comparing Chloride-Based Deicers in Terms of Rebar Corrosion ...
www.coe.montana.edu/me/faculty/.../DeicerTransportationInfrastructure.pdf
[PDF]
report - EVALUATION OF DEICING MATERIALS AND CORROSION REDUCING ...
File Format: PDF/Adobe Acrobat - Quick View
by WA Nixon - 2007 - Related articles
evaluate the claims of new and non-traditional deicing products with regard to their effectiveness and their ability to limit corrosion and other negative ...
www.iowadot.gov/operationsresearch/reports/reports.../tr471.pdf - Similar
Concrete damage
<http://cat.inist.fr/?aModele=afficheN&cpsidt=17403753
Wang, K., D. E. Nelsen, and W.A. Nixon, (2006). “Damaging Effects of Deicing
Chemicals on Concrete Materials,” Journal of Cement and Concrete Composites, vol.
28, issue 2, pp. 173-188, February, 2006.
The damaging impact of various deicing chemicals and exposure conditions on concrete materials was investigated. Five deicing chemicals (sodium chloride, calcium chloride with and without a corrosion inhibitor, potassium acetate, and an agricultural product) were studied. Freezing-thawing (F-T) and wetting-drying (W-D) exposure conditions were considered. Mass loss, scaling, compressive strength, chemical penetration, and micro-structure of the paste and concrete subjected to these deicing chemicals and exposure conditions were evaluated. Results indicated that the various deicing chemicals penetrated at different rates into a given paste and concrete, resulting in different degrees of damage. Among the deicing chemicals tested, two calcium chloride solutions caused the most damage. Addition of a corrosion inhibitor into the calcium chloride solution delayed the onset of damage, but it did not reduce the ultimate damage. Chloride-related deicing chemicals often brought about leaching of calcium hydroxide, as well as chemical alterations in concrete. Potassium acetate caused minor scaling, associated with alkali carbonation of the surface layer of concrete. Although producing a considerable number of micro-pores on the surface of the samples, the agricultural deicing product resulted in the least chemical penetration and scaling damage of paste and concrete.
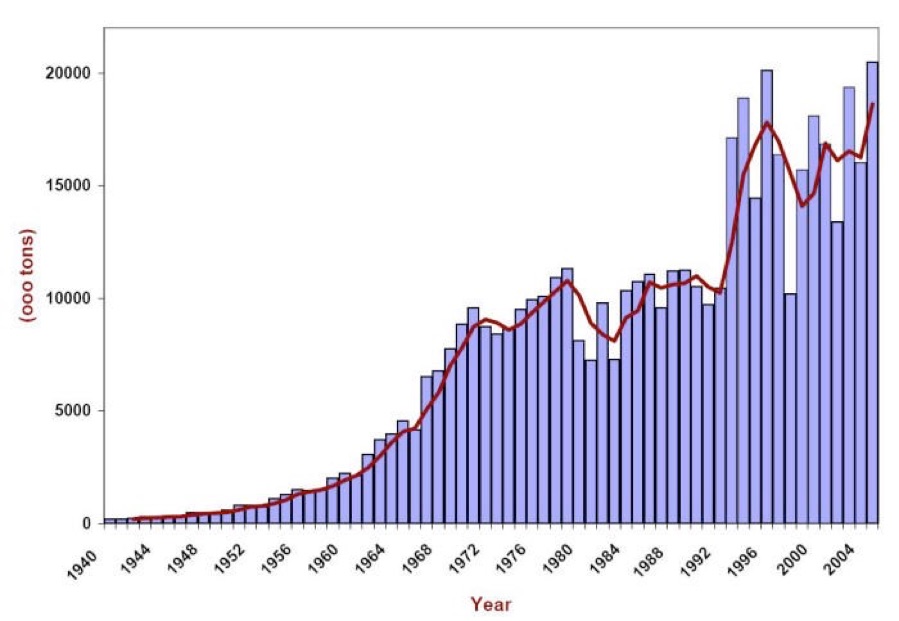
Usage of rock salt for deicing in the U.S. in thousands of tons.
(Data from the Salt Institute http://www.saltinstitute.org/)
<http://corrosion-doctors.org/Corrosion-Atmospheric/Deicing-salts-corrosion.htm>
This graph of national salt usage since 1940


METRO LOUISVILLE’S TOXIC
ROAD SALT POLLUTED GROUNDWATER
The chart above is taken from a 1993 Kentucky Geological Survey of Groundwater chloride concentrations in the KIPDA region of Kentucky and southern Indiana. The data below is 2006 -2008 data supplied by the Louisville Water Company in response to an Open Records Request and shows astronomical chloride poisoning of the groundwater in the vicinity of River Road and Zorn Avenue. Nearby, the giant salt pile of the River Road Terminal sits partially covered.
LWC Data - Test results at Zorn Avenue groundwater test wells ZMW-9A, 9B, 9C from 9-06 to 3-08
9-19-06 Na(mg/L) Chloride (mg/L)
ZMW-9A 2900 4900
ZMW-9B 1700 2700
ZMW-9C 1600 2600
9-29-06 Na(mg/L) Chloride (mg/L)
ZMW-9A 3700 5100
ZMW-9B 1700 2800
ZMW-9C 1500 2500
10-4-06 Na(mg/L) Chloride (mg/L)
ZMW-9A 2800 5000
ZMW-9B 1800 3100
ZMW-9C 1600 2400
11-14-06 Na(mg/L) Chloride (mg/L)
ZMW-9A 3200 5300
ZMW-9B 1600 2900
ZMW-9C 1300 2400
12-13-06 Na(mg/L) Chloride (mg/L)
ZMW-9A 6900 5800
ZMW-9B 1600 2900
ZMW-9C 2800 2100
1-10-07 Na(mg/L) Chloride (mg/L)
ZMW-9A 3500 6000
ZMW-9B 1900 3000
ZMW-9C 1100 1800
2-14-07 Na(mg/L) Chloride (mg/L)
ZMW-9A 7400 6100
ZMW-9B 4300 2600
ZMW-9C 1600 2000
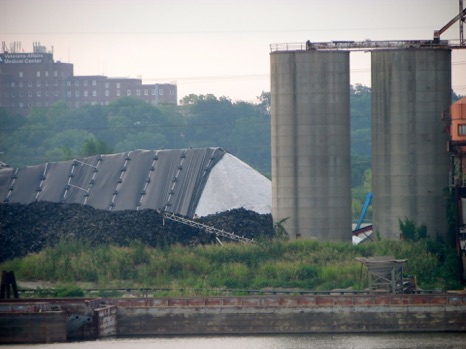
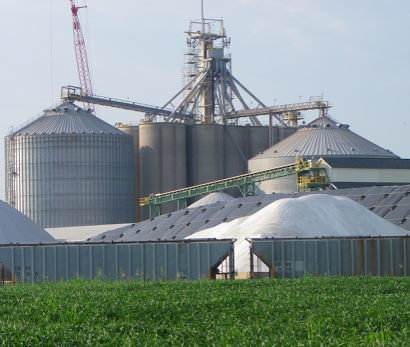
See a road salt barge terminal at:
<http://www.ctlconline.com/TERMINALS/JEFFERSONVILLEIN.aspx>
Graph from--
From icy roads to salty streams See it HERE
The U.S. Environmental Protection Agency (EPA) has
established water quality standards for chloride for the
protection of aquatic life.
Water bodies are considered “impaired” if these standards are violated.
The water quality standard for
chronic exposures is a four-day average concentration of 230 mg/ L not to be exceeded more than once every three years.
The water quality standard for
acute exposures is 860 mg/L for a one-hour average with a similar three year recurrence interval.*
3-13-07 Na(mg/L) Chloride (mg/L)
ZMW-9A 3700 6800
ZMW-9B 1700 3000
ZMW-9C 1200 2100
4-10-07 Na(mg/L) Chloride (mg/L)
ZMW-9A 4000 7000
ZMW-9B 1800 3100
ZMW-9C 1300 2400
5-15-07 Na(mg/L) Chloride (mg/L)
ZMW-9A 4400 7500
ZMW-9B 1800 3000
ZMW-9C 1300 1800
6-13-07 Na(mg/L) Chloride (mg/L)
ZMW-9A 4700 7600
ZMW-9B 1900 3200
ZMW-9C 1000 1800
7-12-07 Na(mg/L) Chloride (mg/L)
ZMW-9A 4000 7100
ZMW-9B 2000 3000
ZMW-9C 1000 1700
8-14-07 Na(mg/L) Chloride (mg/L)
ZMW-9A 4300 7700
ZMW-9B 430 3600
ZMW-9C 210 1700
DATA GAP
3-24-08 Na(mg/L) Chloride (mg/L)
ZMW-9A 4900 8700
ZMW-9B 2400 4200
ZMW-9C 1600 3000
-
*Relating Road Salt to Exceedances of the Water Quality Standard for Chloride in New Hampshire Streams
Philip R. Trowbridge*†, J. Steve Kahl‡, Dari A. Sassan‡, Douglas L. Heath§ and Edward M. Walsh†
Environ. Sci. Technol., 2010, 44 (13), pp 4903–4909
< http://www.forester.net/sw_0107_environmental.html>
“According to the National Research Council (NRC), road-salt use in the United States ranges from 8 million to 12 million tons of NaCl per year. Massachusetts, New Hampshire, and New York report the highest annual road-salt loadings, with Massachusetts the highest at 19.94 tons/lane-mi./yr. New York’s annual road-salt loading averages 500,000 tons/yr. or 16.6 tons/lane-mi./yr. (NRC, 1991). The New York State Department of Transportation (NYSDOT) requires a road-salt application rate of 225 lb./lane-mi. for light snow and 270 lb./lane-mi. for each application during rapidly accumulating snow (NYSDOT, 1993).”
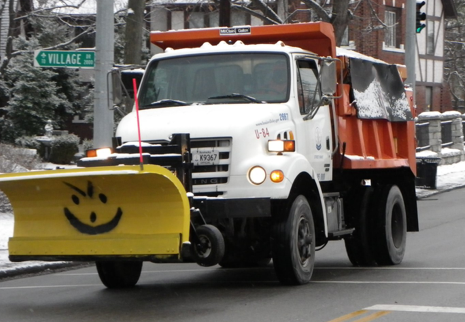
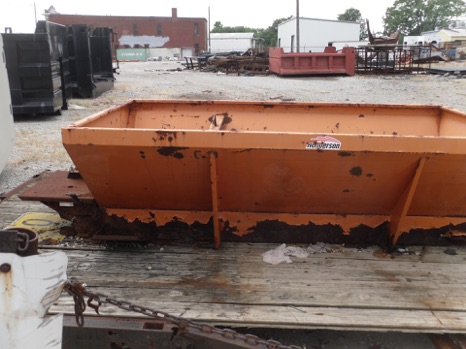
LOUISVILLE’S ROAD SALT ARMY
<http://www.louisvilleky.gov/PublicWorks/snowremovalcenter/>
293 employees and 169 pieces of equipment
to clear 1,362 miles of road in Louisville
- 23 brine distributors; each holds 1,600 gallons of brine
- One brine maker, which produces 5,000 gallons of brine per hour
40,000 tons of salt available for treating roads:
- 15,000 tons of salt on hand at 7 storage facilities, including 4 domes
- 25,000 tons of salt stored underground for emergency reserve
-3,000 tons of salt to be delivered later in the season
Welcome to BadwaterJournal.com© INDEX PAGE for all articles
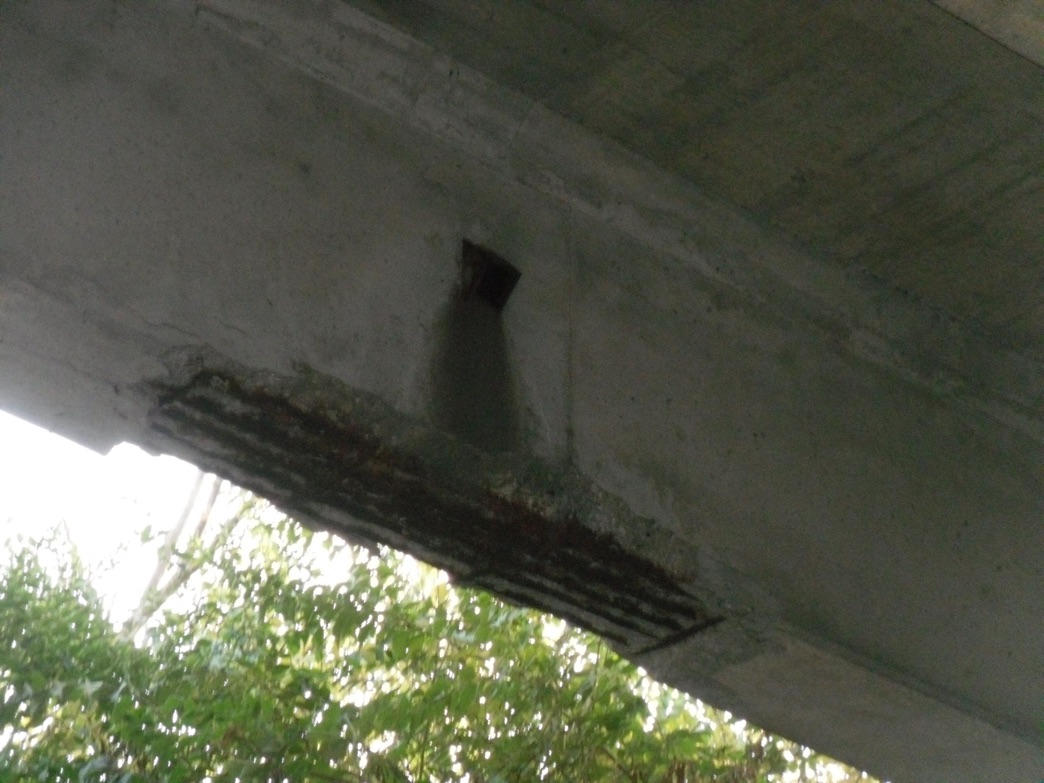
Overpass on I-71 above the Butchertown Greenway showing deicer corrosion of steel reinforcing and concrete disintegration