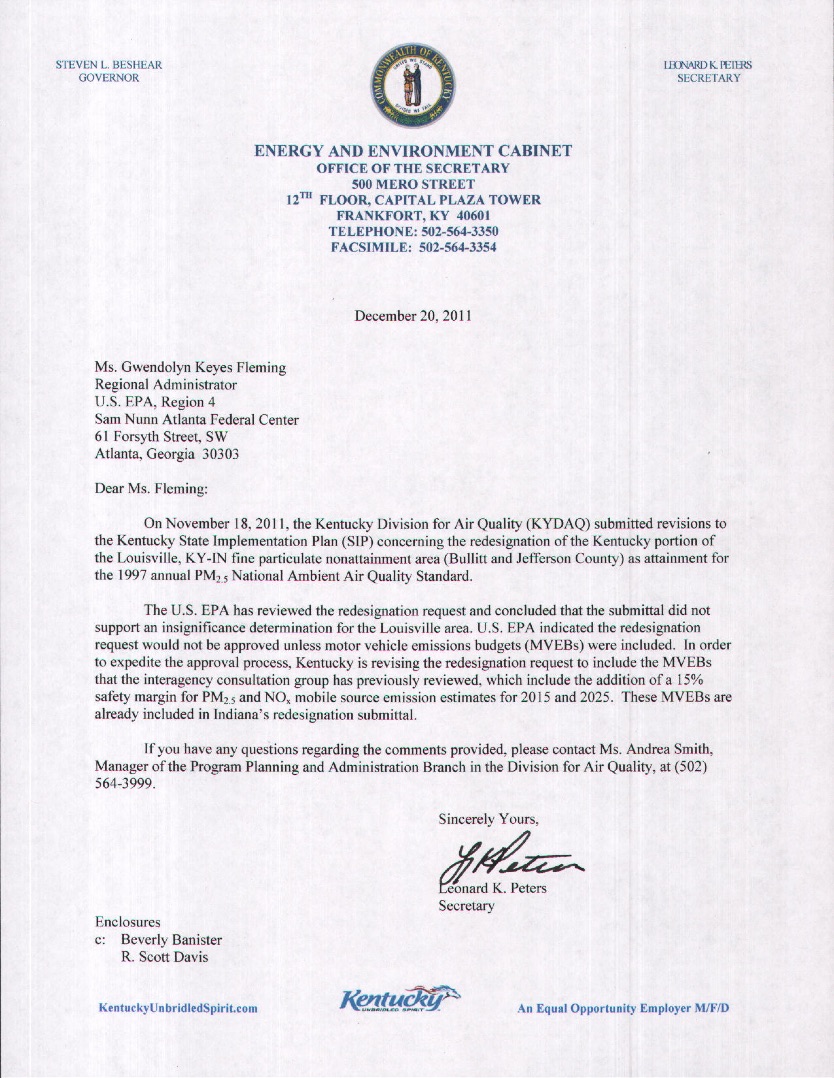
KYDAQ seeks EPA area re-designation to attainment
for PM 2.5
Particulate attainment regulations have loopholes you can drive a truck through
In the case of air particulate, the most visible dangers of combustion air pollution have been eliminated in a victory for public protection. The days of industrial smoke stacks and coal combustion smoke blotting out the sun at midday are gone. Federal regulation works--overcoming the corruption of local industry control of state officials. On November 2,1948, after a week of thick black smog that blotted out the sun at midday, the residents of Donora, Pennsylvania buried their dead. 20 people died from a week of breathing toxic zinc smelter smog when stagnant air trapped the poisonous smoke in their steep sloped valley. In 1970, Democrat Edmund Muskie led the movement to set uniform national standards, enforced at the state level and helped pass the Clean Air Act amendments that laid the foundation of modern pollution control. See Ross & Amter, The Polluters, Oxford University Press, pp 157-160.
Enforceable national standards for air pollution control set a baseline for air quality that bumps against the ever expanding metro vehicle fleet expansion.The automobile industry has wrestled with regulators over the duty to reduce the tons of annual emissions of particulate, carbon monoxide and nitric oxides from truck and automobile fuel combustion. Enormous market pressure has been put on local urban planning officials by car dealers associations and on federal officials by auto manufacturers national lobbying arms to favor automobile traffic planning for urban growth. They want to sell more cars and want the taxpayer to pay for the roads. This all flies in the face of emerging science and economic analysis showing we are poisoning our children with mobile source combustion pollution and sparking global military conflict with other nations seeking to reserve and protect petroleum resources to feed the cars and trucks.
See, for example, http://www.cbsnews.com/stories/2008/12/03/cbsnews_investigates/main4646424.shtml
“The auto industry spent nearly $50 million lobbying Congress in the first nine months of this year. And people tied to the auto industry gave another $15 million in campaign contributions, CBS News investigative correspondent Sharyl Attkisson reports.”
The Kentucky Automobile Dealers Election Trust (K.A.D.E.T.) a PAC registered in Kentucky, hands out thousands of dollars to Kentucky legislative candidates. See the Board of Elections online database at:
http://www.kref.state.ky.us/krefsearch/
After the 1970 Clean Air Act eliminated the most visible choking smoke, significant health risks remain from invisible, fine and ultrafine particulates emitted by mobile sources--trucks and cars.
Particulate
“In accordance with the CAA Amendments, three complete years of monitoring data are required to demonstrate attainment at a monitoring site. The annual PM2.5 primary and secondary ambient air quality standards are met at an ambient air quality monitoring site when the three-year average of the annual average is less than 15.0 μg/m3. While calculating design values, three significant digits must be carried in the computations, with final values rounded to the nearest 0.1 μg/m3. Decimals 0.05 or greater are rounded up, and those less than 0.05 are rounded down, so that 15.049 μg/m3 is the largest concentration that is less than, or equal to 15.0 μg/m3. Values at or below 15.0 μg/m3 meet the standard; values equal to or greater than 15.1 μg/m3 exceed the standard. An area is in compliance with the annual PM2.5 NAAQS only if every monitoring site in the area meets the NAAQS. An individual site's 3-year average of the annual average concentrations is also called the site's design standard.”
EPA had at first set its limits on a rather gross size of small particulate - 10 micrometers in diameter. But then revised the NAAQS -National Ambient Air Quality Standards to control particles 2.5 micrometers in diameter. Current research shows that EPA will have to go even smaller and begin to set NAAQS standards for ultra-fine particulates which are still smaller --100 nano-meters and smaller. These ultrafine particles have been shown to enter deep into lung passages and deliver doses of toxic chemical compounds and metals that are now believed to have significant effects or public health and mortality rates. See article HERE
Micro meter width and micro gram weight
Air pollution terminology can lose you in a welter of acronyms and scientific notation. A basic concept is that the width of small particles is measured in micro-meters--a measurement of length, while the concentration of those 2.5 micrometer width particles for purposes of meeting the NAAQS standards, is regulated by weight in a volume of air sample.
Specifically, the weight of particles 2.5 micro meters wide must not exceed 15 micro-grams inside an air sample volume of one cubic meter. Thus the PM 2.5μm standard is 15 μg/m3.
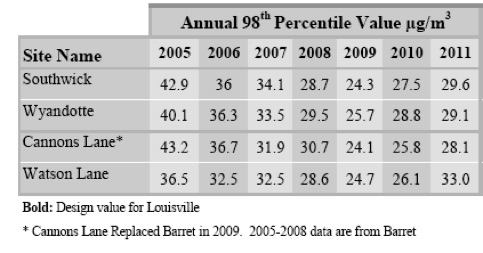
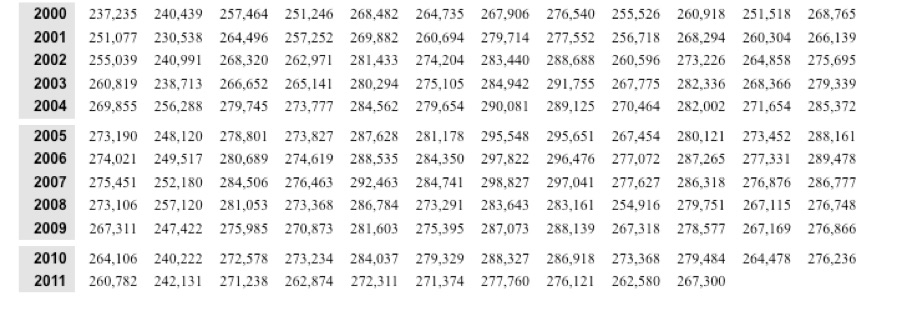
Essentially, the testing equipment uses various methods to blow a cubic meter of air through a filter. The air stream separates particles of the 2.5 micro meter width to accumulate them on the filter of known weight, which is then weighed again to give the weight of the sample by the difference in the two weights. The weights are compiled and a monthly mean weight calculated. This knocks out low readings and high readings. The monthly mean weights are compiled over a year and a yearly mean calculated. This knocks out the low months and the high months. Three years are compiled into a three year mean and this is what is offered to demonstrate compliance with the PM 2.5 5 μm fine particle standard that is set at 15 μg/m3. See the 98th percentile readings at right as an example of daily high readings that are lost in the averaging process. For example a reading at Barret Avenue station (now closed) in 2005 was 43.2 μg/m3. As recent as 2011 Watson Lane station reported a daily high of 33 μg/m3. Four moths out of 2010 exceeded the 15 μg/m3 standard.
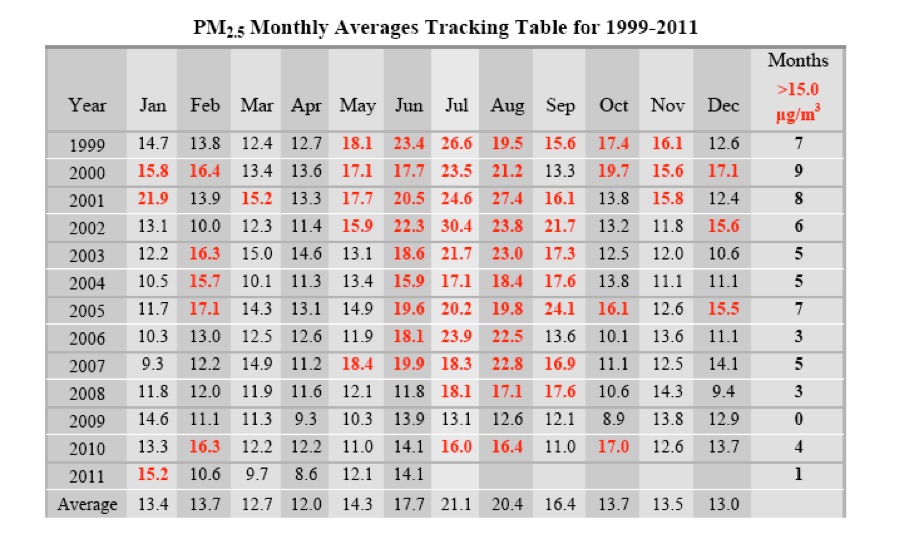
Below is the reported Federal Reference Method gravimetric particulate air monitoring for the Louisville area. Each monthly value is an average mean of four monitoring stations placed around the Louisville area. Hot sunny months of June through September have been associated with higher PM 2.5 results. Red results exceed the PM 2.5 standard.
HEARING FEB 3, 2012 10:00 am 850 Barret Avenue
Kentucky Division for Air Quality has submitted an application to EPA based on three year averaged mean monitoring results.
The application is bundled with a request to approve a state implementation plan-SIP, that purports to enforce and maintain the NAAQS standards.
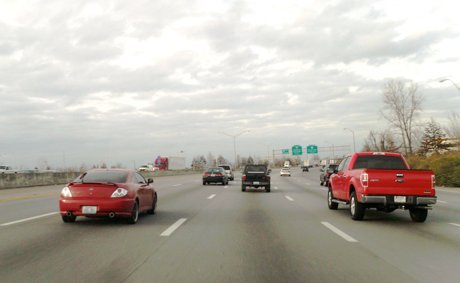
As much as 80% of metro area fine particulate air pollution comes from mobile source fuel combustion. Fine particulate 2.5 micrometers wide and smaller enter the lungs and cause inflammation and tissue death. With new bridges projects and an expanding transportation system, will Louisville be a healthy place?
Online downloadable resources for the PM 2.5 particulate matter re-designation application.
Application materials from KYDAQ - the Kentucky Division of Air Quality, webpage:
http://air.ky.gov/Pages/PublicNoticesandHearings.aspx
The Kentucky Division for Air Quality will conduct a public hearing on Feb. 3, 2012 at 10 a.m. ET in the conference room of the Louisville Metro Air Pollution Control District, 850 Barret Ave., Louisville, Ky. This hearing is being held to receive comments on a proposed State Implementation Plan (SIP) revision to redesignate the Kentucky portion of the Louisville, Kentucky-Indiana area from nonattainment to attainment for the annual PM2.5 National Ambient Air Quality Standard to address sections 107 and 175A of the Clean Air Act (CAA). If no request for a public hearing is received, the hearing will be cancelled and notice of the cancellation will be posted on this website. Further information can be obtained by calling Leslie Eggen at the number below or email at lesliem.eggen@ky.gov
Air monitoring data from LMAPCD - Louisville and Metro Air Pollution Control District webpage:
http://www.louisvilleky.gov/APCD/Monitoring/MonitoringData.htm
monitoring data by month with annual records
http://www.louisvilleky.gov/APCD/Monitoring/MonitoringSites.htm
monitoring stations locations and information
BadWaterJournal article about Monitoring Stations HERE
The Application is based upon ambient air particulate monitoring results plus computer model projections that support the claim that the state will control and enforce air emissions limits to maintain compliance with the NAAQS standards. So, why use 10 year old data for the MVEB-motor vehicle emissions budgets modeling?
“SIP MVEB development was initiated in January, 2010. As of that date, the KIPDA regional travel demand model had been last updated and calibrated during 2005. This update established 2000 as the new base year for the model. The model update utilized the information incorporated into the travel model during previous updates, in particular, information from the 2000 Census and the 2000 KIPDA Household Travel Survey. During the update, the model parameters were adjusted such that the model output matched within reason, three main calibration criteria based on measured data.
These criteria were daily VMT for all highway facilities except local roads for the region; distribution of trip lengths (duration in time); and highway traffic volumes crossing the Ohio River screen-line. The result of the update was a travel model that replicated travel in the Louisville area
for 2000. The subsequent 2011 update and calibration of the TDFM (setting 2007 as a base year) was initiated after work for the PM2.5 redesignation SIP had begun and, therefore, could not be
incorporated into the MOVES model runs.
Pages 16-17 Application
The travel demand model generated from a decade old database of socio-economic living and travel patterns in the Jefferson County area is bound to yield erroneous vehicle miles traveled results. In the past ten years development has exploded in the far east and south ends of the county and the increased number of miles in daily trips from this outer belt increased mileage- didn’t get into the modeling. Applying contemporary emission factors to ten year old driving patterns is the best of both worlds if you want to underestimate mobile source emissions.
World Vehicle Fleet Increasing
now more than 1 billion vehicles
http://www.bts.gov/publications/national_transportation_statistics/html/table_01_11.html
http://en.wikipedia.org/wiki/Motor_vehicle
World U.S. registered all types
1960126,888,000 (U.S.vehicles, vessels
aircraft, other
1970246,378,000 conveyances)
1980410,982,000
1990582,982,000
2000751,830,000 225,821,241
2005863,712,000 247,421,120
2009965,255,000 254,212,610
According to Ward's, the U.S. has the largest fleet of motor vehicles in the world, with 239.8 million by 2010, and vehicle ownership per capita in the U.S. is also the highest in the world with 769 vehicles in operation per 1000 inhabitants, or a ratio of 1:1.3 vehicles to people. The U.S. Department of Energy reports a higher motorization rate of 828 vehicles per 1000 people and a total fleet of 245,441 vehicles by 2009. According to USDoE, the rate of motorization peaked in 2007 at 842.6 vehicles per 1000 people. In terms of licensed drivers, as of 2009 the country had 1.0 vehicle for every licensed.
If Louisville Metro area follows the 1:1.3 ratio there are 569,902 motor vehicles for our population of 741,096 in the 2010 census. From 2000 to 2010 the vehicle fleet increased by nearly one third making 2000 data a poor source for estimating 2010 emissions.
Before
850 Barret Avenue - home of the Air Pollution Control District
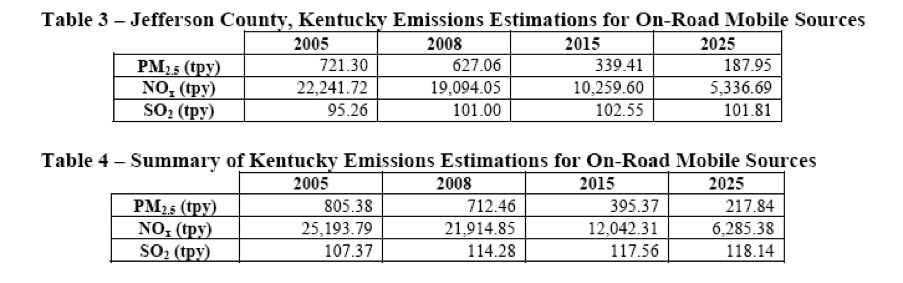
Modeling particulate, Nitrogen oxides and sulphur oxides
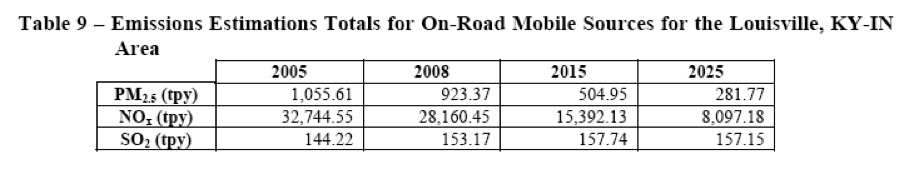
Below are the results of computer modeling using the 2000 socio- economic data and the KIPDA travel demand forecasting data data with EPA emissions factors resulting in predictions of future declines in pollutant emissions for the Louisville Metro Area.
In 2005, there were 1,055.61 annual tons of PM 2.5 emitted by cars and trucks on the roads. This high is predicted to decline for each year thereafter as reductions result from more fuel efficient vehicles including emissions limits on diesel trucks.
Region wide, though there is predicted a 15% increase in population, and a 42% increase in area employment, the beneficial effects of truck and auto emissions reductions are predicted to lower area tonnage.
Page 17
For transit data the results of the 2004 TARC on-board survey was used to supplement the previous information. This was deemed acceptable for several reasons. The primary reason was that the transit network envisioned by Horizon 2030 is essentially the same as the existing one. In addition, the number of total trips from the two models was similar. Therefore, the use of the transit trip information from previous travel models did not change significantly the proportion of trips allocated to transit. Finally, the proportion of trips utilizing transit is less than 2% of the total trips.
So small differences in the number of transit trips should provide a negligible effect on overall travel.
Ultrafine particulate matter exposure augments ischemia-reperfusion injury in mice,
American Journal of Physiology-Heart and Circulatory Physiology, 291: H894–H903, 2006.
Free download the full text article:
<http://ajpheart.physiology.org/content/291/2/H894.full>
THE WORLD HEALTH ORGANIZATION (WHO) recently reported that over 800,000 deaths worldwide per year can be attributed to particulate matter (PM) air pollution (65). Recent epidemiological studies have linked short-term and long-term PM exposure to increased mortality (13, 50). Short-term increases in PM exposure elevate the incidence of myocardial infarction, cardiac arrest, cardiac arrhythmia, and heart failure (12, 43, 63, 66). An analysis by Pope et al. (44) indicated that with every 10 µg/m3 increase in atmospheric fine PM, cardiopulmonary mortality increased by 6%. For a similar increase in atmospheric PM, it has been shown that there is a 2.1% increase in the number of deaths related to ischemic heart disease (51). Taken together, these current studies provide compelling evidence linking PM to adverse cardiovascular effects.
Modeling discussion from pages 15 - 16 of the application
Upon publication of the Federal Register notice, MOVES became U.S. EPA’s approved motor vehicle emission factor model for estimating VOCs, NOx, CO, PM10 and PM2.5 and other pollutants and precursors from cars, trucks, motorcycles, and buses by state and local agencies. MOVES is a computer program designed by the U.S. EPA to estimate air pollution emissions from mobile sources. MOVES replaces U.S. EPA’s previous emissions model for on-road mobile sources, MOBILE6.2. MOVES can be used to estimate exhaust and evaporative emissions as well as brake and tire wear emissions from all types of on-road vehicles.
An updated version of this software, MOVES2010a, was used for the purposes of this analysis. The CAA requires that SIP inventories and control measures be based on the most current information and applicable models that are available when a SIP is developed.
The KIPDA travel demand model is a mathematical model which relates travel to the transportation system and basic socioeconomic information. The domain of the model is a study area which
includes the Louisville (KY-IN) Metropolitan Planning Area. The Louisville (KY-IN) MetropolitanPlanning Area consists of Clark and Floyd counties, and 0.1 square miles in Harrison County, IN,
and Bullitt, Jefferson, and Oldham counties, KY. This area is divided into 807 smaller units called traffic analysis zones.
SIP MVEB development was initiated in January, 2010. As of that date, the KIPDA regional travel demand model had been last updated and calibrated during 2005. This update established 2000 as the new base year for the model. The model update utilized the information incorporated into the travel model during previous updates, in particular, information from the 2000 Census and the 2000 KIPDA Household Travel Survey.
During the update, the model parameters were adjusted such that
the model output matched within reason, three main calibration criteria based on measured data.These criteria were daily VMT for all highway facilities except local roads for the region;
distribution of trip lengths (duration in time); and highway traffic volumes crossing the Ohio River screen-line. The result of the update was a travel model that replicated travel in the Louisville area
for 2000. The subsequent 2011 update and calibration of the TDFM (setting 2007 as a base year) was initiated after work for the PM2.5 redesignation SIP had begun and, therefore, could not be
incorporated into the MOVES model runs.
See more health effects of particulate matter pollution on the webpage PARTICULATE HERE

Data from the U.S. Energy Information Administration shows the drop in fuel consumption when the housing bubble burst and took the economy down. Recent improvements in mobile source emissions reflect among other things -- reduced use.